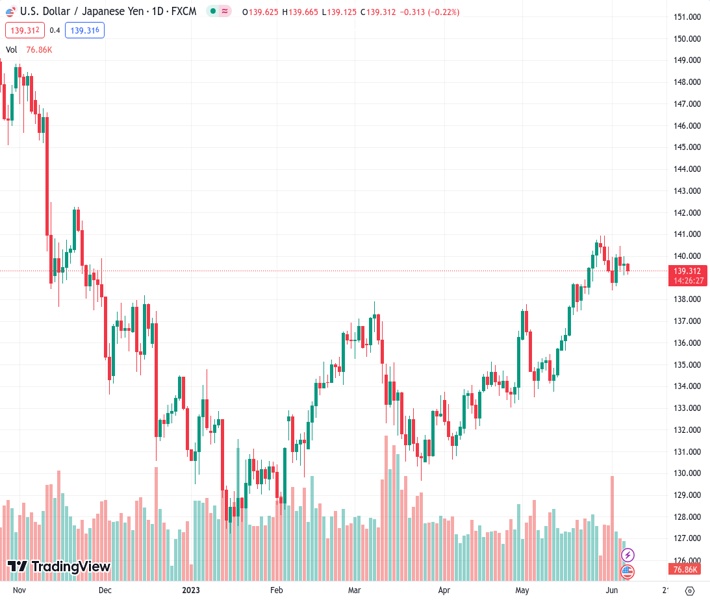
#USDJPY @ 139.315 seems vulnerable above 139.00 as the USD Index is losing its charm. (Pivot Orderbook analysis)
…
This is a premium post.
[s2If !current_user_can(access_s2member_level4)]Please register for FREE REGISTER to read full post below containing analysis. In case of any error or you think you are not able to read the full post below, please email us at support#nehcap.com [lwa][/s2If] [s2If current_user_can(access_s2member_level1)]
- USD/JPY seems vulnerable above 139.00 as the USD Index is losing its charm.
- BoJ Ueda said the central bank will discuss specifics of an exit policy when achievement of the price target is foreseen.
- USD/JPY is expected to display a sheer downside after a breakdown of the Descending Triangle pattern.
The pair currently trades last at 139.315.
The previous day high was 140.0 while the previous day low was 139.1. The daily 38.2% Fib levels comes at 139.65, expected to provide resistance. Similarly, the daily 61.8% fib level is at 139.44, expected to provide resistance.
The USD/JPY pair is juggling in a narrow range above the crucial support of 139.00 in the Asian session. The asset seems vulnerable above the aforementioned support as the US Dollar Index is losing its charm. Where major central banks are gearing up for a fresh interest rate hike, investors are anticipating that the Federal Reserve (Fed) could pause its policy-tightening spell as the impact of interest rate hikes yet made has not passed.
The US Dollar Index (DXY) has witnessed some support after correcting to near 104.00. A squeeze in volatility for the USD Index is anticipated amid an absence of potential economic events this week.
Meanwhile, the Japanese yen has got some strength as Bank of Japan (BoJ) Governor Kazuo Ueda said on Wednesday, “When achievement of price target is foreseen, we will discuss specifics of an exit policy and disclose information as needed.”
USD/JPY is on the verge of delivering a breakdown of the Descending Triangle chart pattern formed on an hourly scale. A breakdown of the aforementioned pattern results in wider ticks and heavy volume.
Declining 20-period Exponential Moving Average (EMA) at 139.43 adds to the downside filters.
The Relative Strength Index (RSI) (14) has shifted into the bearish range of 20.00-40.00, which indicates that downside momentum has been triggered.
A confident break below June 06 low at 139.09 will drag the asset toward March 08 high at 137.92 followed by March 02 high at 137.10
On the flip side, a break above May 31 high at 140.42 will drive the asset toward May 30 high at 140.93. A break above the latter will expose the asset to a fresh six-month high of around 141.61, which is 23 November 2022 high.
Technical Levels: Supports and Resistances
USDJPY currently trading at 139.17 at the time of writing. Pair opened at 139.64 and is trading with a change of -0.34 % .
| Overview | Overview.1 | |
|---|---|---|
| 0 | Today last price | 139.17 |
| 1 | Today Daily Change | -0.47 |
| 2 | Today Daily Change % | -0.34 |
| 3 | Today daily open | 139.64 |
The pair remains strongly bullish on the daily timeframe. It trades above its 20 SMA @ 138.31, 50 SMA 135.65, 100 SMA @ 134.18 and 200 SMA @ 137.3.
| Trends | Trends.1 | |
|---|---|---|
| 0 | Daily SMA20 | 138.31 |
| 1 | Daily SMA50 | 135.65 |
| 2 | Daily SMA100 | 134.18 |
| 3 | Daily SMA200 | 137.30 |
The previous day high was 140.0 while the previous day low was 139.1. The daily 38.2% Fib levels comes at 139.65, expected to provide resistance. Similarly, the daily 61.8% fib level is at 139.44, expected to provide resistance.
Note the levels of interest below:
- Pivot support is noted at 139.16, 138.68, 138.26
- Pivot resistance is noted at 140.06, 140.48, 140.96
| Levels | Levels.1 |
|---|---|
| Previous Daily High | 140.00 |
| Previous Daily Low | 139.10 |
| Previous Weekly High | 140.93 |
| Previous Weekly Low | 138.43 |
| Previous Monthly High | 140.93 |
| Previous Monthly Low | 133.50 |
| Daily Fibonacci 38.2% | 139.65 |
| Daily Fibonacci 61.8% | 139.44 |
| Daily Pivot Point S1 | 139.16 |
| Daily Pivot Point S2 | 138.68 |
| Daily Pivot Point S3 | 138.26 |
| Daily Pivot Point R1 | 140.06 |
| Daily Pivot Point R2 | 140.48 |
| Daily Pivot Point R3 | 140.96 |
[/s2If]
Nehcap Expert Advisor
The NEHCAP MT4 EA is high quality professional trading system geared to generate returns without using GRID or martingales. Each trade has strict risk per trade parameter. The pairs under management include EURUSD, GBPUSD, AUDCAD, AUDNZD,GBPAUD, EURAUD, EURCAD, CHFJPY and many more.
The system is trading live: LIVE ACCOUNT TRACKING
You can run it free. Apply for a free trial and track our account. Buy the system or use profit share mechanism to generate returns on your MT4.
Join Our Telegram Group


