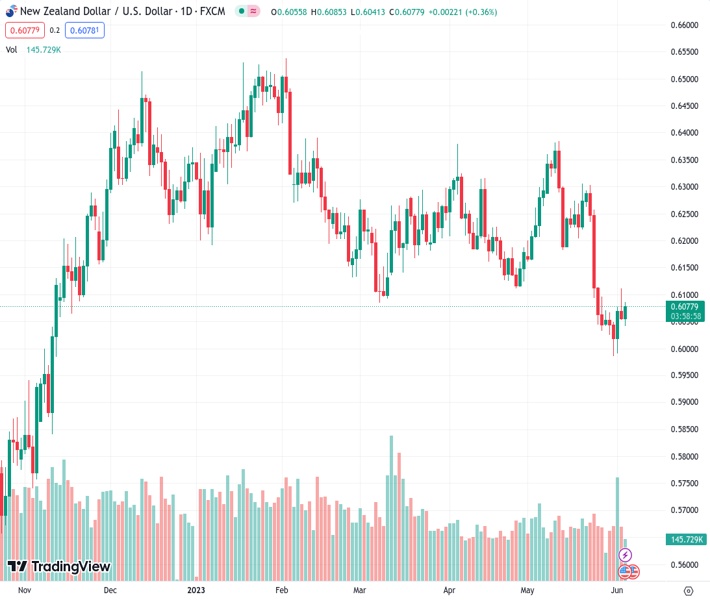
#NZDUSD @ 0.60772 jumped to its highest level since May 26 around 0.6085 after bottoming at November lows last week (Pivot Orderbook analysis)
…
This is a premium post.
[s2If !current_user_can(access_s2member_level4)]Please register for FREE REGISTER to read full post below containing analysis. In case of any error or you think you are not able to read the full post below, please email us at support#nehcap.com [lwa][/s2If] [s2If current_user_can(access_s2member_level1)]
- NZD/USD jumped to its highest level since May 26 around 0.6085 after bottoming at November lows last week
- US ISM Services PMI fell to 50.3 in May.
- S&P Global Composite PMI retreated to 54.3.
The pair currently trades last at 0.60772.
The previous day high was 0.6112 while the previous day low was 0.6055. The daily 38.2% Fib levels comes at 0.6077, expected to provide support. Similarly, the daily 61.8% fib level is at 0.609, expected to provide resistance.
The NZD/USD traded with gains at the beginning of the week near 0.6070, fueled by poor economic data from the US, which sparked a US Dollar sell-off. In reaction to the data, markets are perceiving a stronger case for the Federal Reserve (Fed) not hiking rates in the upcoming meeting on June 13-14 making the US bond yields decline.
The US Institute for Supply Management (ISM) Service PMI came in at 50.3 in May vs the 51.5 expected and decelerated from its previous figure of 51.9. In addition, the S&P Global Composite final estimate for the same month slid to 54.3 vs the 54.5 expected from the last reading of 55.1. Meanwhile, the service sector PMI final revision printed at 54.9 vs the preliminary reading of 55.1.
Following the disappointing data, US bond yields have declined throughout the yield curve. The 10-year bond yield has fallen to 3.69%. Similarly, the 2-year yield stands at 4.48%, while the 5-year yield sits at 3.83%, which weighs on the US Dollar.
According to the CME FedWatch Tool, investors are currently assigning a 77.10% probability to the Federal Reserve maintaining the target rate at 5.25% and not implementing an interest rate hike in the upcoming June 13-14 meeting. However, it is worth highlighting that the Fed’s primary objective of achieving full employment and price stability remains steadfast. As a result, the release of the May Consumer Price Index (CPI) on June 13 will play a crucial role in shaping the FOMC’s (Federal Open Market Committee) expectations and considerations for future interest rate decisions and hence impacting the US Dollar price dynamics.
Technically speaking, the NZD/USD maintains a neutral to a bearish outlook for the short term, as per indicators on the daily chart. The Relative Strength Index (RSI) and Moving Average Convergence Divergence (MACD), despite standing in negative territory, show a loss of momentum, suggesting that sellers seem to have run out of steam.
On the upside, upcoming resistance for NZD/USD is seen at the daily high of 0.6085, followed by the psychological mark at 0.6100 and June 2 high around 0.6115. On the other hand, if the Kiwi retakes the downside, immediate support levels are seen at the daily low at 0.6040, followed by the psychological mark at the 0.6000 level and the cycle low at 0.5985.
Technical Levels: Supports and Resistances
NZDUSD currently trading at 0.6078 at the time of writing. Pair opened at 0.6061 and is trading with a change of 0.28 % .
| Overview | Overview.1 | |
|---|---|---|
| 0 | Today last price | 0.6078 |
| 1 | Today Daily Change | 0.0017 |
| 2 | Today Daily Change % | 0.2800 |
| 3 | Today daily open | 0.6061 |
The pair remains strongly bearish on the daily time frame. It trades below the 20 SMA @ 0.6181, 50 SMA 0.6204, 100 SMA @ 0.625 and 200 SMA @ 0.615.
| Trends | Trends.1 | |
|---|---|---|
| 0 | Daily SMA20 | 0.6181 |
| 1 | Daily SMA50 | 0.6204 |
| 2 | Daily SMA100 | 0.6250 |
| 3 | Daily SMA200 | 0.6150 |
The previous day high was 0.6112 while the previous day low was 0.6055. The daily 38.2% Fib levels comes at 0.6077, expected to provide support. Similarly, the daily 61.8% fib level is at 0.609, expected to provide resistance.
Note the levels of interest below:
- Pivot support is noted at 0.604, 0.6019, 0.5983
- Pivot resistance is noted at 0.6097, 0.6133, 0.6154
| Levels | Levels.1 |
|---|---|
| Previous Daily High | 0.6112 |
| Previous Daily Low | 0.6055 |
| Previous Weekly High | 0.6112 |
| Previous Weekly Low | 0.5985 |
| Previous Monthly High | 0.6385 |
| Previous Monthly Low | 0.5985 |
| Daily Fibonacci 38.2% | 0.6077 |
| Daily Fibonacci 61.8% | 0.6090 |
| Daily Pivot Point S1 | 0.6040 |
| Daily Pivot Point S2 | 0.6019 |
| Daily Pivot Point S3 | 0.5983 |
| Daily Pivot Point R1 | 0.6097 |
| Daily Pivot Point R2 | 0.6133 |
| Daily Pivot Point R3 | 0.6154 |
[/s2If]
Nehcap Expert Advisor
The NEHCAP MT4 EA is high quality professional trading system geared to generate returns without using GRID or martingales. Each trade has strict risk per trade parameter. The pairs under management include EURUSD, GBPUSD, AUDCAD, AUDNZD,GBPAUD, EURAUD, EURCAD, CHFJPY and many more.
The system is trading live: LIVE ACCOUNT TRACKING
You can run it free. Apply for a free trial and track our account. Buy the system or use profit share mechanism to generate returns on your MT4.
Join Our Telegram Group


