#USDJPY @ 139.677 US Dollar weakens across the board following lower-than-expected ISM Service PMI. (Pivot Orderbook analysis)
…
This is a premium post.
[s2If !current_user_can(access_s2member_level4)]Please register for FREE REGISTER to read full post below containing analysis. In case of any error or you think you are not able to read the full post below, please email us at support#nehcap.com [lwa][/s2If] [s2If current_user_can(access_s2member_level1)]
- US Dollar weakens across the board following lower-than-expected ISM Service PMI.
- US yields decline sharply after data, benefiting the Yen.
- USD/JPY extends reversal from six-day highs.
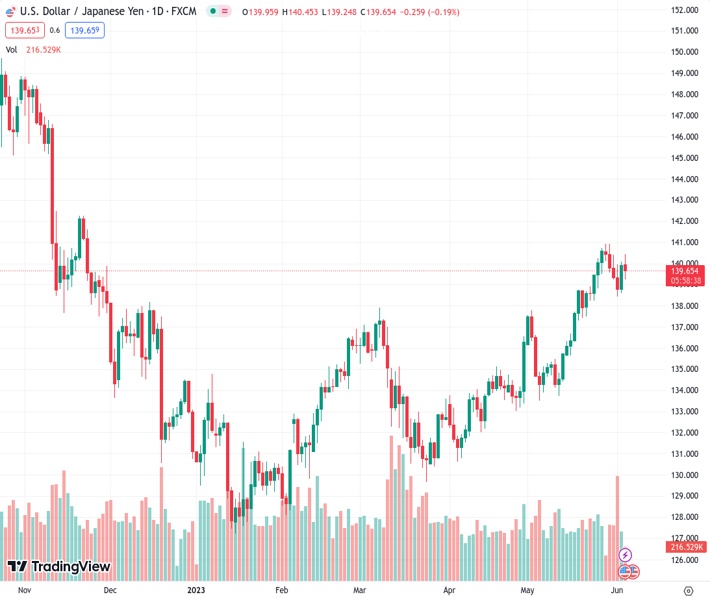
The pair currently trades last at 139.677.
The previous day high was 140.07 while the previous day low was 138.6. The daily 38.2% Fib levels comes at 139.51, expected to provide support. Similarly, the daily 61.8% fib level is at 139.16, expected to provide support.
The USD/JPY experienced a sharp drop below 140.00 after the release of US economic data that weighed on the US Dollar. Within a few minutes, the pair lost more than 50 pips, reaching a fresh daily low at 139.25. It remains near the lows, under pressure.
The May S&P Global Services PMI was revised down from 55.1 to 54.9. More importantly, the ISM Services PMI for May came in at 50.3, the lowest level since May 2020, falling short of expectations of 51.5 and below April’s figure of 51.9. The Prices Paid Index also fell from 59.6 to 56.2, and the Employment Index dropped to 49.2, indicating contraction.
In addition, a separate report showed that Factory Orders rose by 0.4% in April, below the market consensus of 0.5%.
These figures triggered weakness in the US Dollar across the board. The US Dollar Index dropped from 104.30, hitting daily lows below 104.00. US Treasury yields also turned negative, with the 10-year sliding from 3.75% to 3.66% and the 2-year from 4.55% to 4.43%.
The rally in Treasuries boosted the Japanese Yen, which is also benefiting from the slide in equity prices on Wall Street. As a result, the yen is one of the top performers so far on Monday.
The USD/JPY reached a high of 140.45 on Monday, which was the highest level it had seen since May 30th. However, it began to pull back and accelerated its descent after the release of US data. The pair was unable to maintain a level above 140.00.
On the 4-hour chart, the USD/JPY has fallen below its 20-period Simple Moving Average (SMA). Immediate support is at 139.20, followed by the 138.95/139.00 zone. If the pair continues to decline, attention will turn to last week’s low at 138.40. A recovery above 139.60 could alleviate the bearish pressure.
Technical Levels: Supports and Resistances
USDJPY currently trading at 139.35 at the time of writing. Pair opened at 139.96 and is trading with a change of -0.44 % .
| Overview | Overview.1 | |
|---|---|---|
| 0 | Today last price | 139.35 |
| 1 | Today Daily Change | -0.61 |
| 2 | Today Daily Change % | -0.44 |
| 3 | Today daily open | 139.96 |
The pair remains strongly bullish on the daily timeframe. It trades above its 20 SMA @ 137.86, 50 SMA 135.32, 100 SMA @ 133.96 and 200 SMA @ 137.29.
| Trends | Trends.1 | |
|---|---|---|
| 0 | Daily SMA20 | 137.86 |
| 1 | Daily SMA50 | 135.32 |
| 2 | Daily SMA100 | 133.96 |
| 3 | Daily SMA200 | 137.29 |
The previous day high was 140.07 while the previous day low was 138.6. The daily 38.2% Fib levels comes at 139.51, expected to provide support. Similarly, the daily 61.8% fib level is at 139.16, expected to provide support.
Note the levels of interest below:
- Pivot support is noted at 139.02, 138.08, 137.56
- Pivot resistance is noted at 140.49, 141.01, 141.95
| Levels | Levels.1 |
|---|---|
| Previous Daily High | 140.07 |
| Previous Daily Low | 138.60 |
| Previous Weekly High | 140.93 |
| Previous Weekly Low | 138.43 |
| Previous Monthly High | 140.93 |
| Previous Monthly Low | 133.50 |
| Daily Fibonacci 38.2% | 139.51 |
| Daily Fibonacci 61.8% | 139.16 |
| Daily Pivot Point S1 | 139.02 |
| Daily Pivot Point S2 | 138.08 |
| Daily Pivot Point S3 | 137.56 |
| Daily Pivot Point R1 | 140.49 |
| Daily Pivot Point R2 | 141.01 |
| Daily Pivot Point R3 | 141.95 |
[/s2If]
Nehcap Expert Advisor
The NEHCAP MT4 EA is high quality professional trading system geared to generate returns without using GRID or martingales. Each trade has strict risk per trade parameter. The pairs under management include EURUSD, GBPUSD, AUDCAD, AUDNZD,GBPAUD, EURAUD, EURCAD, CHFJPY and many more.
The system is trading live: LIVE ACCOUNT TRACKING
You can run it free. Apply for a free trial and track our account. Buy the system or use profit share mechanism to generate returns on your MT4.
Join Our Telegram Group


