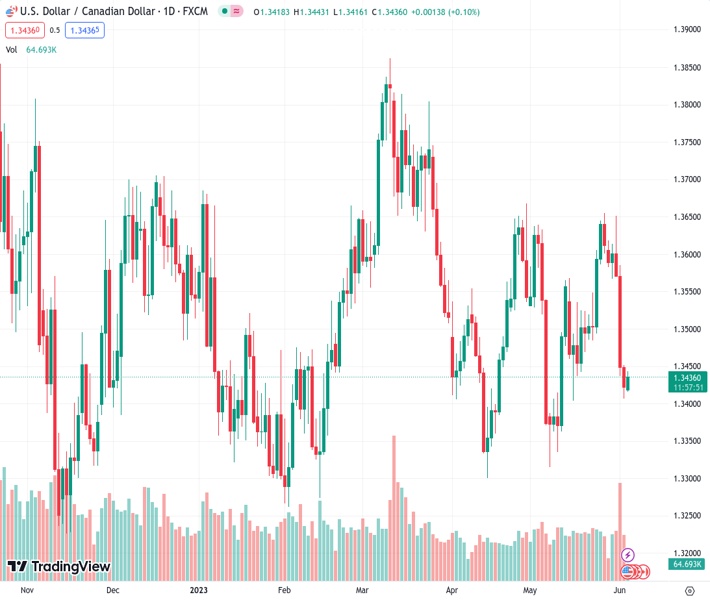
#USDCAD @ 1.34361 gains some positive traction on Monday amid some follow-through USD buying. (Pivot Orderbook analysis)
…
This is a premium post.
[s2If !current_user_can(access_s2member_level4)]Please register for FREE REGISTER to read full post below containing analysis. In case of any error or you think you are not able to read the full post below, please email us at support#nehcap.com [lwa][/s2If] [s2If current_user_can(access_s2member_level1)]
- USD/CAD gains some positive traction on Monday amid some follow-through USD buying.
- Bets for another 25 bps Fed rate hike in June push the US bond yields higher and the USD.
- Bullish Crude Oil prices underpin the Loonie and might cap any further gains for the pair.
The pair currently trades last at 1.34361.
The previous day high was 1.3452 while the previous day low was 1.3407. The daily 38.2% Fib levels comes at 1.3424, expected to provide support. Similarly, the daily 61.8% fib level is at 1.3435, expected to provide support.
The USD/CAD pair attracts some buying near the 200-day Exponential Moving Average (EMA) on Monday and sticks to its modest intraday gains through the early part of the European session. The pair currently trades around the 1.3430-1.3435 region, up nearly 0.10% for the day, and for now, seems to have snapped a three-day losing streak to the 1.3400 mark, or a nearly three-week low touched on Friday.
The US Dollar (USD) gains some follow-through traction for the second successive day and turns out to be a key factor acting as a tailwind for the USD/CAD pair. Despite the mixed US monthly employment details, the markets area still pricing in another 25 bps lift-off by the Federal Reserve (Fed) later this month. This remains supportive of a further rise in the US Treasury bond yields and pushes the Greenback higher on the first day of a new week. That said, the prevalent risk-on mood might hold back traders from placing aggressive bullish bets around the safe-haven buck.
The markets continue to cheer the optimism over the passage of legislation to lift the government’s $31.4 trillion debt ceiling to avert an unprecedented American default. Adding to this, a private-sector survey showed on Monday that China’s services activity picked up in May and boosted investors’ confidence, which is evident from a generally positive tone around the equity markets. This, along with an intraday rally in Crude Oil prices, which tends to underpin the commodity-linked Loonie, further contributes to capping any meaningful upside for the USD/CAD pair.
In fact, Oil prices opened with a bullish gap on Monday in reaction to an OPEC+ agreement over the weekend to extend at least 3.66 million bpd of cuts till end-2024 from end-2023. Adding to this, Saudi Arabia pledged to cut its production by about 1 million bpd in July to 9 million bpd and lends additional support to the black liquid. This, in turn, makes it prudent to wait for a strong follow-through buying around the USD/CAD pair before positioning for any further appreciating move ahead of the release of the US ISM Services PMI later during the early North American session.
Technical Levels: Supports and Resistances
USDCAD currently trading at 1.3436 at the time of writing. Pair opened at 1.3425 and is trading with a change of 0.08 % .
| Overview | Overview.1 | |
|---|---|---|
| 0 | Today last price | 1.3436 |
| 1 | Today Daily Change | 0.0011 |
| 2 | Today Daily Change % | 0.0800 |
| 3 | Today daily open | 1.3425 |
The pair remains strongly bearish on the daily time frame. It trades below the 20 SMA @ 1.3505, 50 SMA 1.3507, 100 SMA @ 1.3518 and 200 SMA @ 1.3507.
| Trends | Trends.1 | |
|---|---|---|
| 0 | Daily SMA20 | 1.3505 |
| 1 | Daily SMA50 | 1.3507 |
| 2 | Daily SMA100 | 1.3518 |
| 3 | Daily SMA200 | 1.3507 |
The previous day high was 1.3452 while the previous day low was 1.3407. The daily 38.2% Fib levels comes at 1.3424, expected to provide support. Similarly, the daily 61.8% fib level is at 1.3435, expected to provide support.
Note the levels of interest below:
- Pivot support is noted at 1.3404, 1.3383, 1.3358
- Pivot resistance is noted at 1.345, 1.3474, 1.3495
| Levels | Levels.1 |
|---|---|
| Previous Daily High | 1.3452 |
| Previous Daily Low | 1.3407 |
| Previous Weekly High | 1.3651 |
| Previous Weekly Low | 1.3407 |
| Previous Monthly High | 1.3655 |
| Previous Monthly Low | 1.3315 |
| Daily Fibonacci 38.2% | 1.3424 |
| Daily Fibonacci 61.8% | 1.3435 |
| Daily Pivot Point S1 | 1.3404 |
| Daily Pivot Point S2 | 1.3383 |
| Daily Pivot Point S3 | 1.3358 |
| Daily Pivot Point R1 | 1.3450 |
| Daily Pivot Point R2 | 1.3474 |
| Daily Pivot Point R3 | 1.3495 |
[/s2If]
Nehcap Expert Advisor
The NEHCAP MT4 EA is high quality professional trading system geared to generate returns without using GRID or martingales. Each trade has strict risk per trade parameter. The pairs under management include EURUSD, GBPUSD, AUDCAD, AUDNZD,GBPAUD, EURAUD, EURCAD, CHFJPY and many more.
The system is trading live: LIVE ACCOUNT TRACKING
You can run it free. Apply for a free trial and track our account. Buy the system or use profit share mechanism to generate returns on your MT4.
Join Our Telegram Group


