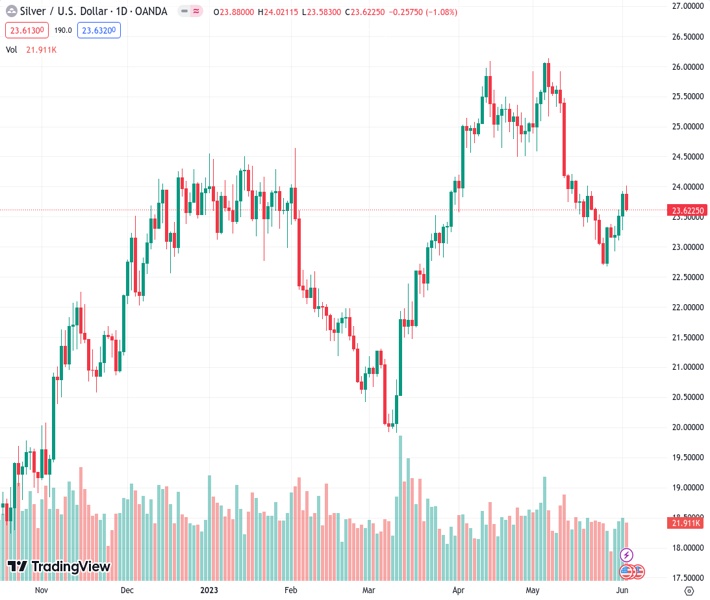
#XAGUSD @ 23.598 Silver price pulls back as robust US jobs report strengthens Treasury bond yields. (Pivot Orderbook analysis)
…
This is a premium post.
[s2If !current_user_can(access_s2member_level4)]Please register for FREE REGISTER to read full post below containing analysis. In case of any error or you think you are not able to read the full post below, please email us at support#nehcap.com [lwa][/s2If] [s2If current_user_can(access_s2member_level1)]
- Silver price pulls back as robust US jobs report strengthens Treasury bond yields.
- Expectations for a July rate hike by the Fed mount, pressuring precious metals.
- Resolution of US debt-ceiling drama provides potential respite for Silver.
The pair currently trades last at 23.598.
The previous day high was 23.92 while the previous day low was 23.28. The daily 38.2% Fib levels comes at 23.68, expected to provide resistance. Similarly, the daily 61.8% fib level is at 23.53, expected to provide support.
Silver price makes a U-turn following the path of Gold, as precious metals weighed by high US Treasury bond yields edge lower. XAG/USD opened around the daily highs and printed a weekly high of $24.00 before retreating past the 50- and 20-day Exponential Moving Averages (EMAs) confluence at the time of writing. XAG/USD is trading at $23.61, down 0.01%.
XAG/USD slid on a hotter-than-expected US Nonfarm Payrolls report in May, which revealed that 339K Americans entered the workforce, more than one and a half expected of 190K. The headline data suggests the Federal Reserve (Fed) still has some work. Still, the Unemployment Rate saw signs of upward pressure, from 3.4% to 3.7% YoY, while Average Hourly Earnings, seen as wages inflation, stood at 4.3% YoY, a tick lower than April’s.
Given the amount of data revealed, traders brace for a July rate hike by the Fed, aligning themselves with recent Fed officials’ commentary, led by the Chair Jerome Powell, saying the US central bank could skip a meeting to see the effects of 500 bps of tightening. Vice-Chair nominee Philip Jefferson and the Philadelphia Fed President Patrick Harker reinforced the message.
Therefore US Treasury bond yields exploded to the upside, a headwind for the precious metals segment. US Treasury bond yields climbed, with 2s up 16 bps to 4.501%, while 10s stand at 3.689%, gaining nine bps. The US Dollar Index (DXY), which tracks the greenback’s value against a basket of six currencies, rose 0.46%, up at 104.041, but set to finish the week on the wrong foot.
On the geopolitical sphere, the US debt-ceiling saga finished with a happy ending, with both chambers, the US House and the Senate passing the bill, easing fears of a possible US government default. The bill would be signed into law by US President Joe Biden over the weekend.
Given the fundamental backdrop, the XAG/USD shifted from neutral upward biased to neutral. The Relative Strength Index (RSI) indicator dodged the 50-midline and aimed downwards, suggesting that sellers are still in place. But the 3-day Rate of Change (RoC) indicates that selling pressure is beginning to fade. It means the white metal could remain sideways, awaiting the next catalyst.
Upwards, resistance levels lie at the 20-day EMA at $23.79, the 50-day EMA at $23.91, and the $24.00 figure. Conversely, XAG/USD support levels are the 100-day EMA at $23.47, the $23.00 psychological price level, and the 200-day EMA At $22.85.
Technical Levels: Supports and Resistances
XAGUSD currently trading at 23.61 at the time of writing. Pair opened at 23.88 and is trading with a change of -1.13 % .
| Overview | Overview.1 | |
|---|---|---|
| 0 | Today last price | 23.61 |
| 1 | Today Daily Change | -0.27 |
| 2 | Today Daily Change % | -1.13 |
| 3 | Today daily open | 23.88 |
The pair is trading below its 20 Daily moving average @ 23.97, below its 50 Daily moving average @ 24.44 , above its 100 Daily moving average @ 23.36 and above its 200 Daily moving average @ 22.1
| Trends | Trends.1 | |
|---|---|---|
| 0 | Daily SMA20 | 23.97 |
| 1 | Daily SMA50 | 24.44 |
| 2 | Daily SMA100 | 23.36 |
| 3 | Daily SMA200 | 22.10 |
The previous day high was 23.92 while the previous day low was 23.28. The daily 38.2% Fib levels comes at 23.68, expected to provide resistance. Similarly, the daily 61.8% fib level is at 23.53, expected to provide support.
Note the levels of interest below:
- Pivot support is noted at 23.47, 23.05, 22.82
- Pivot resistance is noted at 24.11, 24.34, 24.75
| Levels | Levels.1 |
|---|---|
| Previous Daily High | 23.92 |
| Previous Daily Low | 23.28 |
| Previous Weekly High | 23.92 |
| Previous Weekly Low | 22.68 |
| Previous Monthly High | 26.14 |
| Previous Monthly Low | 22.68 |
| Daily Fibonacci 38.2% | 23.68 |
| Daily Fibonacci 61.8% | 23.53 |
| Daily Pivot Point S1 | 23.47 |
| Daily Pivot Point S2 | 23.05 |
| Daily Pivot Point S3 | 22.82 |
| Daily Pivot Point R1 | 24.11 |
| Daily Pivot Point R2 | 24.34 |
| Daily Pivot Point R3 | 24.75 |
[/s2If]
Nehcap Expert Advisor
The NEHCAP MT4 EA is high quality professional trading system geared to generate returns without using GRID or martingales. Each trade has strict risk per trade parameter. The pairs under management include EURUSD, GBPUSD, AUDCAD, AUDNZD,GBPAUD, EURAUD, EURCAD, CHFJPY and many more.
The system is trading live: LIVE ACCOUNT TRACKING
You can run it free. Apply for a free trial and track our account. Buy the system or use profit share mechanism to generate returns on your MT4.
Join Our Telegram Group


