#XAUUSD @ 1948.77 Gold price dips despite week’s strong showing; US job growth exceeds expectations. (Pivot Orderbook analysis)
…
This is a premium post.
[s2If !current_user_can(access_s2member_level4)]Please register for FREE REGISTER to read full post below containing analysis. In case of any error or you think you are not able to read the full post below, please email us at support#nehcap.com [lwa][/s2If] [s2If current_user_can(access_s2member_level1)]
- Gold price dips despite week’s strong showing; US job growth exceeds expectations.
- Rising US Treasury bond yields and a robust USD exert downward pressure on gold.
- US debt-ceiling resolution eases bond yields, potential respite for gold.
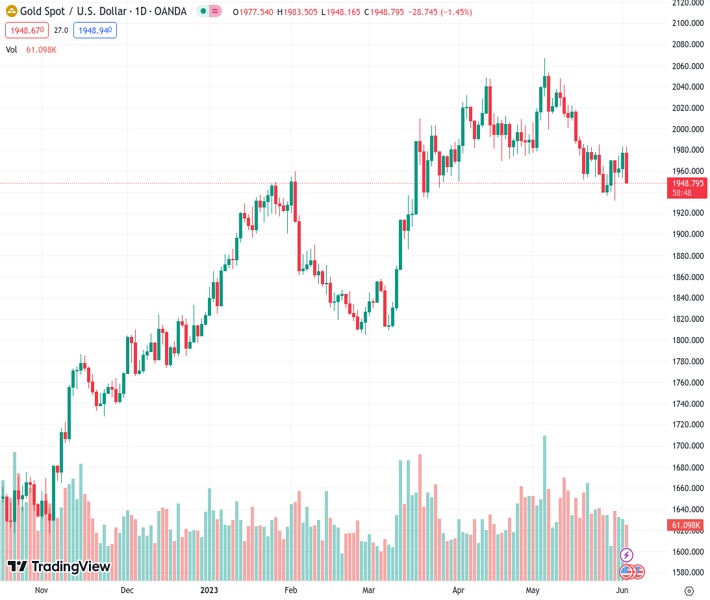
The pair currently trades last at 1948.77.
The previous day high was 1983.17 while the previous day low was 1953.41. The daily 38.2% Fib levels comes at 1971.8, expected to provide resistance. Similarly, the daily 61.8% fib level is at 1964.78, expected to provide resistance.
Gold price slumps after hitting a daily high of $1977.87, as the release of a solid US jobs data report underpinned US Treasury bond yields, a headwind for the yellow metal. That, alongside a strong US Dollar (USD), keeps XAU/USD downward pressured but still set to end the week with decent gains. At the time of writing, the XAU/USD is trading below the $1950 area.
A risk on impulse keeps safe-haven assets under pressure, as Wall Street shrugged off a solid employment report from the United States (US). On Friday, the US Department of Labor revealed May’s Nonfarm Payrolls report, which crushed estimates of 190K, as the economy created 339K jobs. Regardings to the Unemployment Rate grew by 3.7% YoY from 3.4%.
US Treasury bond yields reacted to the upside, with 2s jumping 16 bps to 4.501%, while 10s stand at 3.689%, gaining nine bps. The greenback edged up 0.43% as shown by the US Dollar Index at 104.026, ready to post its first weekly loss, snapping three weeks of gains.
Bets that the US Federal Reserve will keep rates unchanged at the June meeting increased, although, in July, it is almost sure that the US central bank will raise rates by 25 bps.
Should be said that once the US House and Senate approved the US debt-ceiling bill, US bond yields dropped. The bill would be signed by US President Joe Biden during the weekend, ending the soap opera.
XAU/USD is neutral to downward biased, even though the Gold spot remains trading above the 200-day Exponential Moving Average (EMA) at $1886.98. As the yellow metal registered successive series of lower highs, despite pending confirmation for a second lower-low, it turned the bias slightly downwards.
Oscillators like the Relative Strength Index (RSI) and the 3-day Rate of Change (RoC) suggests sellers are in charge though a decisive break below $1950 would put them in the driver’s seat to challenge the 200-day EMA.
XAU/USD first support would be $1950, followed by the 100-day EMA at $1936.30. Once cleared, $1900 is up next. On the other hand, the XAU/USD first resistance would be the 50-day EMA at $1970.78, closely followed by the 20-day EMA at $1972.86. Upside risks lie at $2000.
Technical Levels: Supports and Resistances
XAUUSD currently trading at 1950.31 at the time of writing. Pair opened at 1977.76 and is trading with a change of -1.39 % .
| Overview | Overview.1 | |
|---|---|---|
| 0 | Today last price | 1950.31 |
| 1 | Today Daily Change | -27.45 |
| 2 | Today Daily Change % | -1.39 |
| 3 | Today daily open | 1977.76 |
The pair is trading below its 20 Daily moving average @ 1984.35, below its 50 Daily moving average @ 1992.3 , above its 100 Daily moving average @ 1938.6 and above its 200 Daily moving average @ 1834.73
| Trends | Trends.1 | |
|---|---|---|
| 0 | Daily SMA20 | 1984.35 |
| 1 | Daily SMA50 | 1992.30 |
| 2 | Daily SMA100 | 1938.60 |
| 3 | Daily SMA200 | 1834.73 |
The previous day high was 1983.17 while the previous day low was 1953.41. The daily 38.2% Fib levels comes at 1971.8, expected to provide resistance. Similarly, the daily 61.8% fib level is at 1964.78, expected to provide resistance.
Note the levels of interest below:
- Pivot support is noted at 1959.72, 1941.69, 1929.96
- Pivot resistance is noted at 1989.48, 2001.21, 2019.24
| Levels | Levels.1 |
|---|---|
| Previous Daily High | 1983.17 |
| Previous Daily Low | 1953.41 |
| Previous Weekly High | 1985.30 |
| Previous Weekly Low | 1936.77 |
| Previous Monthly High | 2079.76 |
| Previous Monthly Low | 1932.12 |
| Daily Fibonacci 38.2% | 1971.80 |
| Daily Fibonacci 61.8% | 1964.78 |
| Daily Pivot Point S1 | 1959.72 |
| Daily Pivot Point S2 | 1941.69 |
| Daily Pivot Point S3 | 1929.96 |
| Daily Pivot Point R1 | 1989.48 |
| Daily Pivot Point R2 | 2001.21 |
| Daily Pivot Point R3 | 2019.24 |
[/s2If]
Nehcap Expert Advisor
The NEHCAP MT4 EA is high quality professional trading system geared to generate returns without using GRID or martingales. Each trade has strict risk per trade parameter. The pairs under management include EURUSD, GBPUSD, AUDCAD, AUDNZD,GBPAUD, EURAUD, EURCAD, CHFJPY and many more.
The system is trading live: LIVE ACCOUNT TRACKING
You can run it free. Apply for a free trial and track our account. Buy the system or use profit share mechanism to generate returns on your MT4.
Join Our Telegram Group


