#USDJPY @ 139.860 Headline employment growth in the US rose by 339k in May. (Pivot Orderbook analysis)
…
This is a premium post.
[s2If !current_user_can(access_s2member_level4)]Please register for FREE REGISTER to read full post below containing analysis. In case of any error or you think you are not able to read the full post below, please email us at support#nehcap.com [lwa][/s2If] [s2If current_user_can(access_s2member_level1)]
- Headline employment growth in the US rose by 339k in May.
- The US Unemployment rate rose to 3.7%.
- Wage inflation slightly decreased.
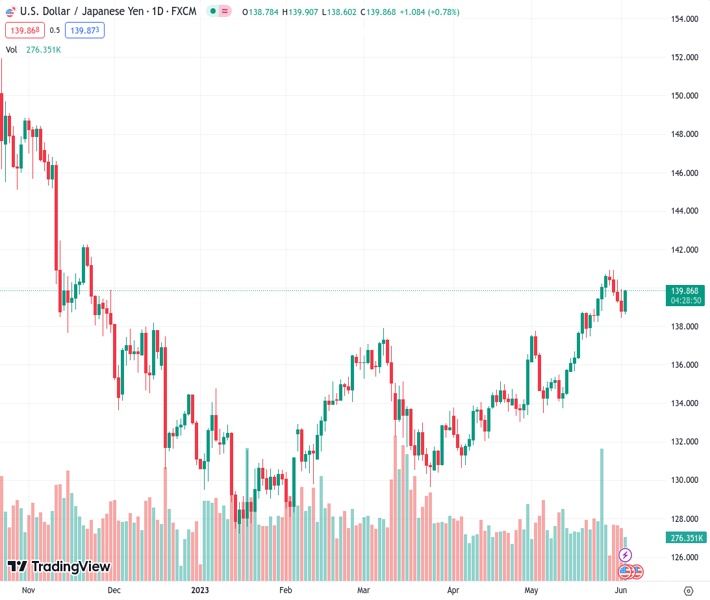
The pair currently trades last at 139.860.
The previous day high was 139.95 while the previous day low was 138.43. The daily 38.2% Fib levels comes at 139.01, expected to provide support. Similarly, the daily 61.8% fib level is at 139.37, expected to provide support.
The USD/JPY gained more than 60 pips on Friday, spiking to the 139.70 zone following the labor market data from the US which suggested that the Federal Reserve (Fed) may reconsider a further hike. As a reaction, the US Dollar gained traction on the back of rising US bond yields while Japanese yields continue to decline.
The US Bureau of Labor Statistics released that employment in the US measured by the Nonfarm payrolls (NFP) increased by 339k, way above the consensus of 190k. The Bureau stated that job gains were seen across various sectors, with notable increases in professional and business services and government employment. Other figures show that the Unemployment rate picked up to 3.7% in the same period of time vs the 3.5% expected while wage inflation measured by the Average Hourly Earnings, came in at 4.3% YoY vs the 4.4% expected.
In that sense, while signs of slowing labor demand have emerged, the strong employment growth and persistent inflation are pressuring the Fed to consider further rate hikes which fueled an increase of the US bond yields. The US bond yields experienced an increase as a result of strong employment growth and persistent inflation, putting pressure on the Federal Reserve to consider raising interest rates. The 10-year bond yield in the US increased by 1%, reaching 3.67%. Additionally, the 2-year yield in the US rose by 1.98% to stand at 4.47%, while the 5-year yield increased by 1.29% to reach 3.79% and the increase of the US rates seem to be attracting foreign investors and hence supporting the US Dollar.
However, the CME FedWatch tool suggests that markets still discount higher odds of a no hike by the Fed in the June 13-14 meeting, while the probabilities of a 25 basis point (bps) hike increased slightly to 30%.
In contrast, Japanese bond yields declined. The 10-year yield decreased by 1.68% to 0.41%, while the 2-year yield fell by 9.7% to stand at -0.07%. Furthermore, the 5-year yield in Japan experienced an 8.78% decrease, reaching 0.07% and applied further pressure on the Yen..
According to the daily chart, the USD/JPY holds a bullish outlook for the short term as the Relative Strength Index (RSI) and Moving Average Convergence Divergence (MACD) both suggest that the buyers are in control while the pair trades above its main moving averages. The 4-hour chart also suggests bulls dominance as the mentioned indicators jumped from negative territory to positive zone.
The 140.00 level is key for USD/JPY to gain further traction. If cleared, we could see a more pronounced move towards the 140.50 zone and the psychological mark at 141.00. On the other hand, immediate support for USD/JPY is seen at the 138.90 zone level, followed by the 138.50 level and the psychological mark at 138.00.
Technical Levels: Supports and Resistances
USDJPY currently trading at 139.83 at the time of writing. Pair opened at 138.79 and is trading with a change of 0.75 % .
| Overview | Overview.1 | |
|---|---|---|
| 0 | Today last price | 139.83 |
| 1 | Today Daily Change | 1.04 |
| 2 | Today Daily Change % | 0.75 |
| 3 | Today daily open | 138.79 |
The pair remains strongly bullish on the daily timeframe. It trades above its 20 SMA @ 137.61, 50 SMA 135.13, 100 SMA @ 133.84 and 200 SMA @ 137.28.
| Trends | Trends.1 | |
|---|---|---|
| 0 | Daily SMA20 | 137.61 |
| 1 | Daily SMA50 | 135.13 |
| 2 | Daily SMA100 | 133.84 |
| 3 | Daily SMA200 | 137.28 |
The previous day high was 139.95 while the previous day low was 138.43. The daily 38.2% Fib levels comes at 139.01, expected to provide support. Similarly, the daily 61.8% fib level is at 139.37, expected to provide support.
Note the levels of interest below:
- Pivot support is noted at 138.16, 137.54, 136.64
- Pivot resistance is noted at 139.69, 140.58, 141.21
| Levels | Levels.1 |
|---|---|
| Previous Daily High | 139.95 |
| Previous Daily Low | 138.43 |
| Previous Weekly High | 140.72 |
| Previous Weekly Low | 137.49 |
| Previous Monthly High | 140.93 |
| Previous Monthly Low | 133.50 |
| Daily Fibonacci 38.2% | 139.01 |
| Daily Fibonacci 61.8% | 139.37 |
| Daily Pivot Point S1 | 138.16 |
| Daily Pivot Point S2 | 137.54 |
| Daily Pivot Point S3 | 136.64 |
| Daily Pivot Point R1 | 139.69 |
| Daily Pivot Point R2 | 140.58 |
| Daily Pivot Point R3 | 141.21 |
[/s2If]
Nehcap Expert Advisor
The NEHCAP MT4 EA is high quality professional trading system geared to generate returns without using GRID or martingales. Each trade has strict risk per trade parameter. The pairs under management include EURUSD, GBPUSD, AUDCAD, AUDNZD,GBPAUD, EURAUD, EURCAD, CHFJPY and many more.
The system is trading live: LIVE ACCOUNT TRACKING
You can run it free. Apply for a free trial and track our account. Buy the system or use profit share mechanism to generate returns on your MT4.
Join Our Telegram Group


