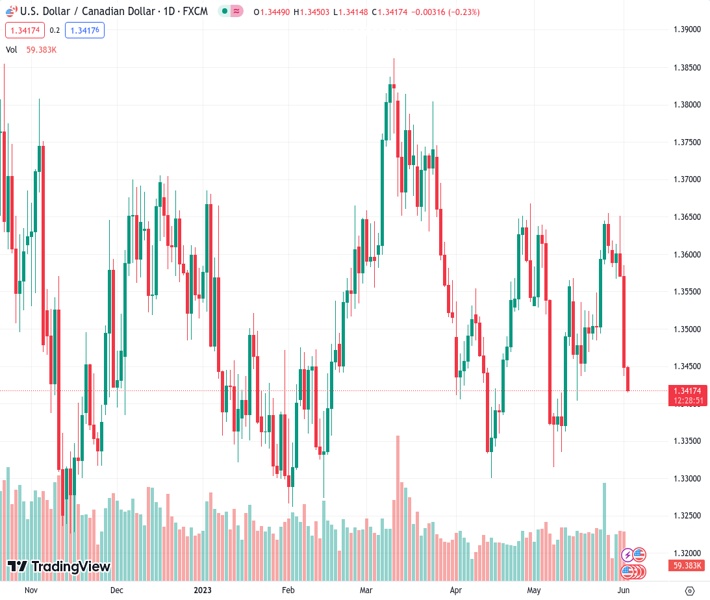
#USDCAD @ 1.34158 continues losing ground for the third straight day and drops to a nearly three-week low. (Pivot Orderbook analysis)
…
This is a premium post.
[s2If !current_user_can(access_s2member_level4)]Please register for FREE REGISTER to read full post below containing analysis. In case of any error or you think you are not able to read the full post below, please email us at support#nehcap.com [lwa][/s2If] [s2If current_user_can(access_s2member_level1)]
- USD/CAD continues losing ground for the third straight day and drops to a nearly three-week low.
- A further recovery in Oil prices underpins the Loonie and exerts pressure amid a weaker Greenback.
- Reduced bets for another 25 bps Fed rate hike in June weigh on the USD ahead of the NFP report.
The pair currently trades last at 1.34158.
The previous day high was 1.3585 while the previous day low was 1.3436. The daily 38.2% Fib levels comes at 1.3493, expected to provide resistance. Similarly, the daily 61.8% fib level is at 1.3528, expected to provide resistance.
The USD/CAD pair drifts lower for the third successive day on Friday – also marking the fifth day of a negative move in the previous six – and drops to a two-and-half-week low during the early part of the European session. The pair currently trades around the 1.3420-1.3415 region, down over 0.20% for the day, and is pressured by a combination of factors.
Crude Oil prices add to the overnight strong recovery gains and rally another 1% on the last day of the week, which, in turn, is seen underpinning the commodity-linked Loonie. The US Dollar (USD), on the other hand, remains depressed amid expectations that the Federal Reserve (Fed) will likely skip an interest rate hike at its meeting later this month and further contributes to the offered tone surrounding the USD/CAD pair.
In fact, Philadelphia Fed President Patrick Harker reiterated on Thursday that it’s time to at least hit the stop button for one meeting and see how it goes. This, along with the recent comments by several influential FOMC officials, forced investors to scale back their bets for another 25 bps lift-off in June. This led to a further decline in the US Treasury bond yields on Thursday and continues to weigh on the Greenback.
Furthermore, the passage of legislation to lift the US government’s $31.4 trillion debt ceiling and avert an unprecedented American default boosts investors’ confidence. The optimism remains supportive of a generally positive risk tone around the equity markets and turns out to be another factor weighing on the safe-haven Greenback. This, in turn, supports prospects for a further intraday downfall for the USD/CAD pair.
Traders, however, might refrain from placing aggressive bets and prefer to wait on the sidelines ahead of the release of the closely-watched US monthly employment details, due later during the early North American session. The popularly known NFP report will play a key role in driving the USD demand, which, along with Oil price dynamics, should allow traders to grab short-term opportunities around the USD/CAD pair.
Technical Levels: Supports and Resistances
USDCAD currently trading at 1.342 at the time of writing. Pair opened at 1.345 and is trading with a change of -0.22 % .
| Overview | Overview.1 | |
|---|---|---|
| 0 | Today last price | 1.342 |
| 1 | Today Daily Change | -0.003 |
| 2 | Today Daily Change % | -0.220 |
| 3 | Today daily open | 1.345 |
The pair remains strongly bearish on the daily time frame. It trades below the 20 SMA @ 1.3502, 50 SMA 1.3513, 100 SMA @ 1.3517 and 200 SMA @ 1.3505.
| Trends | Trends.1 | |
|---|---|---|
| 0 | Daily SMA20 | 1.3502 |
| 1 | Daily SMA50 | 1.3513 |
| 2 | Daily SMA100 | 1.3517 |
| 3 | Daily SMA200 | 1.3505 |
The previous day high was 1.3585 while the previous day low was 1.3436. The daily 38.2% Fib levels comes at 1.3493, expected to provide resistance. Similarly, the daily 61.8% fib level is at 1.3528, expected to provide resistance.
Note the levels of interest below:
- Pivot support is noted at 1.3396, 1.3342, 1.3247
- Pivot resistance is noted at 1.3544, 1.3639, 1.3693
| Levels | Levels.1 |
|---|---|
| Previous Daily High | 1.3585 |
| Previous Daily Low | 1.3436 |
| Previous Weekly High | 1.3655 |
| Previous Weekly Low | 1.3485 |
| Previous Monthly High | 1.3655 |
| Previous Monthly Low | 1.3315 |
| Daily Fibonacci 38.2% | 1.3493 |
| Daily Fibonacci 61.8% | 1.3528 |
| Daily Pivot Point S1 | 1.3396 |
| Daily Pivot Point S2 | 1.3342 |
| Daily Pivot Point S3 | 1.3247 |
| Daily Pivot Point R1 | 1.3544 |
| Daily Pivot Point R2 | 1.3639 |
| Daily Pivot Point R3 | 1.3693 |
[/s2If]
Nehcap Expert Advisor
The NEHCAP MT4 EA is high quality professional trading system geared to generate returns without using GRID or martingales. Each trade has strict risk per trade parameter. The pairs under management include EURUSD, GBPUSD, AUDCAD, AUDNZD,GBPAUD, EURAUD, EURCAD, CHFJPY and many more.
The system is trading live: LIVE ACCOUNT TRACKING
You can run it free. Apply for a free trial and track our account. Buy the system or use profit share mechanism to generate returns on your MT4.
Join Our Telegram Group


