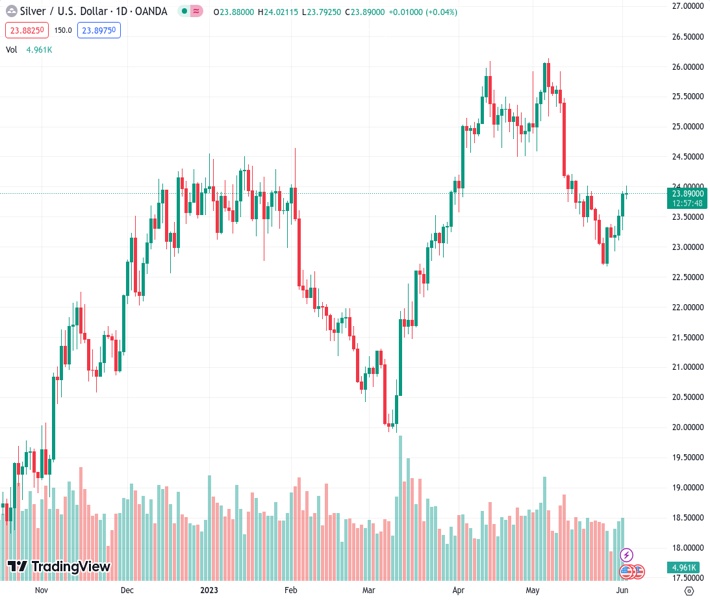
#XAGUSD @ 23.880 Silver climbs to a two-week high on Friday, albeit struggles to capitalize on the move. (Pivot Orderbook analysis)
…
This is a premium post.
[s2If !current_user_can(access_s2member_level4)]Please register for FREE REGISTER to read full post below containing analysis. In case of any error or you think you are not able to read the full post below, please email us at support#nehcap.com [lwa][/s2If] [s2If current_user_can(access_s2member_level1)]
- Silver climbs to a two-week high on Friday, albeit struggles to capitalize on the move.
- Bulls now await a sustained move beyond the $24.00 mark before placing fresh bets.
- Weakness below the 100-day SMA is needed to negate the near-term positive outlook.
The pair currently trades last at 23.880.
The previous day high was 23.92 while the previous day low was 23.28. The daily 38.2% Fib levels comes at 23.68, expected to provide support. Similarly, the daily 61.8% fib level is at 23.53, expected to provide support.
Silver builds on its recent goodish rebound from sub-$23.00 levels and climbs to a two-week high on Friday, albeit struggles to capitalize on the modest intraday uptick. The white metal pulls back from the vicinity of the $24.00 mark, representing the 38.2% Fibonacci retracement level of the downfall in May, and trades with a mild positive bias during the early European session.
From a technical perspective, this week’s sustained move beyond the 100-day Simple Moving Average (SMA) and the overnight break through the 23.6% Fibo. level favours bullish traders. Moreover, oscillators on the daily chart have recovered from the negative territory, though are yet to confirm a positive outlook. This makes it prudent to wait for some follow-through buying beyond the $24.00 mark before positioning for an extension of the recent bounce from over a two-month low touched last week.
The XAG/USD might then accelerate the momentum towards the next relevant hurdle near the $24.20-$24.25 region en route to the $24.40-$24.50 horizontal support breakpoint. The latter coincides with the 50% Fibo. level, above which a fresh bout of a short-covering should allow bullish traders to reclaim the $25.00 psychological mark. The upward trajectory could get extended towards the $25.30-$25.35 supply zone before the commodity eventually makes a fresh attempt to conquer the $26.00 mark.
On the flip side, any meaningful pullback now seems to attract fresh buyers near the mid-$23.00s, or the 23.6% Fibo. level. This should help limit the downside for the XAG/USD near the 100-day SMA, currently pegged around the $23..35 area. That said, a convincing break below will expose the $23.00 mark. This is followed by the May monthly swing low, around the $22.70-$22.65 region, which if broken decisively will negate any positive outlook and shift the bias back in favour of bearish traders.
Technical Levels: Supports and Resistances
XAGUSD currently trading at 23.89 at the time of writing. Pair opened at 23.88 and is trading with a change of 0.04 % .
| Overview | Overview.1 | |
|---|---|---|
| 0 | Today last price | 23.89 |
| 1 | Today Daily Change | 0.01 |
| 2 | Today Daily Change % | 0.04 |
| 3 | Today daily open | 23.88 |
The pair is trading below its 20 Daily moving average @ 23.97, below its 50 Daily moving average @ 24.44 , above its 100 Daily moving average @ 23.36 and above its 200 Daily moving average @ 22.1
| Trends | Trends.1 | |
|---|---|---|
| 0 | Daily SMA20 | 23.97 |
| 1 | Daily SMA50 | 24.44 |
| 2 | Daily SMA100 | 23.36 |
| 3 | Daily SMA200 | 22.10 |
The previous day high was 23.92 while the previous day low was 23.28. The daily 38.2% Fib levels comes at 23.68, expected to provide support. Similarly, the daily 61.8% fib level is at 23.53, expected to provide support.
Note the levels of interest below:
- Pivot support is noted at 23.47, 23.05, 22.82
- Pivot resistance is noted at 24.11, 24.34, 24.75
| Levels | Levels.1 |
|---|---|
| Previous Daily High | 23.92 |
| Previous Daily Low | 23.28 |
| Previous Weekly High | 23.92 |
| Previous Weekly Low | 22.68 |
| Previous Monthly High | 26.14 |
| Previous Monthly Low | 22.68 |
| Daily Fibonacci 38.2% | 23.68 |
| Daily Fibonacci 61.8% | 23.53 |
| Daily Pivot Point S1 | 23.47 |
| Daily Pivot Point S2 | 23.05 |
| Daily Pivot Point S3 | 22.82 |
| Daily Pivot Point R1 | 24.11 |
| Daily Pivot Point R2 | 24.34 |
| Daily Pivot Point R3 | 24.75 |
[/s2If]
Nehcap Expert Advisor
The NEHCAP MT4 EA is high quality professional trading system geared to generate returns without using GRID or martingales. Each trade has strict risk per trade parameter. The pairs under management include EURUSD, GBPUSD, AUDCAD, AUDNZD,GBPAUD, EURAUD, EURCAD, CHFJPY and many more.
The system is trading live: LIVE ACCOUNT TRACKING
You can run it free. Apply for a free trial and track our account. Buy the system or use profit share mechanism to generate returns on your MT4.
Join Our Telegram Group


