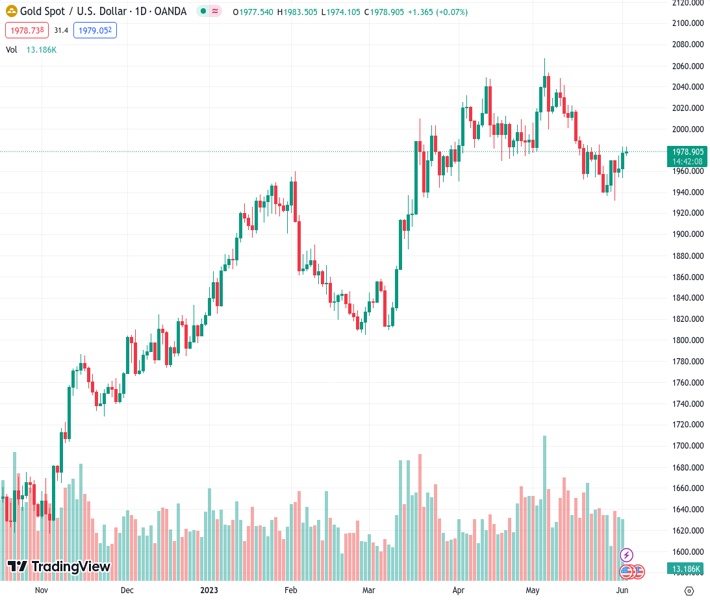
#XAUUSD @ 1,979.19 Gold price is making efforts for keeping auction confidently above $1,980.00 amid the delicate USD Index. (Pivot Orderbook analysis)
…
This is a premium post.
[s2If !current_user_can(access_s2member_level4)]Please register for FREE REGISTER to read full post below containing analysis. In case of any error or you think you are not able to read the full post below, please email us at support#nehcap.com [lwa][/s2If] [s2If current_user_can(access_s2member_level1)]
- Gold price is making efforts for keeping auction confidently above $1,980.00 amid the delicate USD Index.
- Market sentiment is quite positive after the clearance of the US debt-ceiling bill in Congress.
- The only catalyst that can save the USD index from a further casualty is the US NFP data.
The pair currently trades last at 1979.19.
The previous day high was 1983.17 while the previous day low was 1953.41. The daily 38.2% Fib levels comes at 1971.8, expected to provide support. Similarly, the daily 61.8% fib level is at 1964.78, expected to provide support.
Gold price (XAU/USD) is looking to fit its auction above $1,980.00 in the early European session. The precious metal has been fueled with fresh blood as the USD Index is expected to remain in the bearish trajectory amid the absence of recovery signals.
S&P500 futures have posted decent gains in Asia as the market sentiment is quite positive after the clearance of the US debt-ceiling bill in Congress and a decline in expectations of one more interest rate hike from the Federal Reserve (Fed).
The US Dollar Index has refreshed its weekly low at 103.45 as Fed policymakers are favoring a pause in June’s monetary policy meeting considering the fact that US domestic factory activities are consistently contracting.
The only catalyst that can save the USD index from a further casualty is the United States Nonfarm Payrolls (NFP) data. Economists at Commerzbank expect if the US labor market report for May is strong and above expectations, the Dollar could rise. Further, they added that given the fairly stable downward trend in employment growth, they expect 200K new jobs to have been created in May after 253K in April. This would probably keep the unemployment rate at 3.4%. The noticeable weakening of the labor market desired by the US Federal Reserve, which could dampen inflation, would thus not yet be achieved.
Gold price has delivered a breakout of the downward-sloping trendline plotted from an all-time high at $2,079.76 on a two-hour scale. The precious metal is gathering strength for breaking above the horizontal resistance plotted from May 19 high at $1,984.25.
Gold price has climbed above the 200-period Exponential Moving Average (EMA) at $1,973.58, which conveys that the long-term trend has turned bullish.
The Relative Strength Index (RSI) (14) has shifted into the bullish range of 60.00-80.00, which indicates that the upside momentum is active now.
Technical Levels: Supports and Resistances
XAUUSD currently trading at 1980.59 at the time of writing. Pair opened at 1977.76 and is trading with a change of 0.14 % .
| Overview | Overview.1 | |
|---|---|---|
| 0 | Today last price | 1980.59 |
| 1 | Today Daily Change | 2.83 |
| 2 | Today Daily Change % | 0.14 |
| 3 | Today daily open | 1977.76 |
The pair is trading below its 20 Daily moving average @ 1984.35, below its 50 Daily moving average @ 1992.3 , above its 100 Daily moving average @ 1938.6 and above its 200 Daily moving average @ 1834.73
| Trends | Trends.1 | |
|---|---|---|
| 0 | Daily SMA20 | 1984.35 |
| 1 | Daily SMA50 | 1992.30 |
| 2 | Daily SMA100 | 1938.60 |
| 3 | Daily SMA200 | 1834.73 |
The previous day high was 1983.17 while the previous day low was 1953.41. The daily 38.2% Fib levels comes at 1971.8, expected to provide support. Similarly, the daily 61.8% fib level is at 1964.78, expected to provide support.
Note the levels of interest below:
- Pivot support is noted at 1959.72, 1941.69, 1929.96
- Pivot resistance is noted at 1989.48, 2001.21, 2019.24
| Levels | Levels.1 |
|---|---|
| Previous Daily High | 1983.17 |
| Previous Daily Low | 1953.41 |
| Previous Weekly High | 1985.30 |
| Previous Weekly Low | 1936.77 |
| Previous Monthly High | 2079.76 |
| Previous Monthly Low | 1932.12 |
| Daily Fibonacci 38.2% | 1971.80 |
| Daily Fibonacci 61.8% | 1964.78 |
| Daily Pivot Point S1 | 1959.72 |
| Daily Pivot Point S2 | 1941.69 |
| Daily Pivot Point S3 | 1929.96 |
| Daily Pivot Point R1 | 1989.48 |
| Daily Pivot Point R2 | 2001.21 |
| Daily Pivot Point R3 | 2019.24 |
[/s2If]
Nehcap Expert Advisor
The NEHCAP MT4 EA is high quality professional trading system geared to generate returns without using GRID or martingales. Each trade has strict risk per trade parameter. The pairs under management include EURUSD, GBPUSD, AUDCAD, AUDNZD,GBPAUD, EURAUD, EURCAD, CHFJPY and many more.
The system is trading live: LIVE ACCOUNT TRACKING
You can run it free. Apply for a free trial and track our account. Buy the system or use profit share mechanism to generate returns on your MT4.
Join Our Telegram Group


