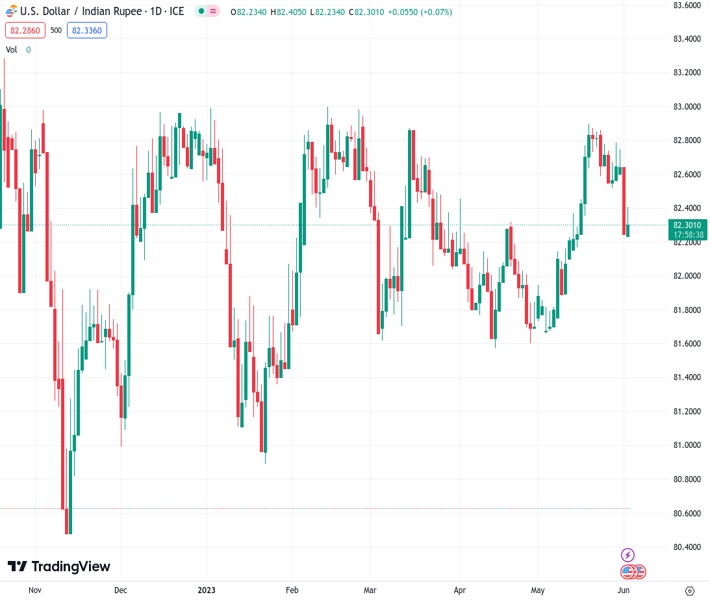
#USDINR @ 82.3240 has sensed resistance around 82.40 amid weakness in the USD Index. (Pivot Orderbook analysis)
…
This is a premium post.
[s2If !current_user_can(access_s2member_level4)]Please register for FREE REGISTER to read full post below containing analysis. In case of any error or you think you are not able to read the full post below, please email us at support#nehcap.com [lwa][/s2If] [s2If current_user_can(access_s2member_level1)]
- USD/INR has sensed resistance around 82.40 amid weakness in the USD Index.
- The Indian Rupee will also remain on tenterhooks as the RBI is expected to keep its repo rate steady.
- USD/INR has witnessed a steep fall after a breakdown of the inventory distribution.
The pair currently trades last at 82.3240.
The previous day high was 82.737 while the previous day low was 82.2675. The daily 38.2% Fib levels comes at 82.4469, expected to provide resistance. Similarly, the daily 61.8% fib level is at 82.5577, expected to provide resistance.
The USD/INR pair has sensed selling pressure around 82.40 in the Asian session amid a sheer sell-off in the US Dollar Index (DXY). The USD Index fell like a house of cards as a few Federal Reserve (Fed) policymakers delivered dovish commentary for June’s monetary policy. Going forward, the release of the United States Nonfarm Payrolls (NFP) data will remain in the spotlight.
It looks like the Indian Rupee will also remain on tenterhooks as the Reserve Bank of India (RBI) is expected to keep its repo rate steady in its monetary policy meeting scheduled for June 6-8.
A survey from Bloomberg showed that the RBI will keep its repo rate steady at 6.5% throughout the year and will announce a rate cut by 25 basis points (bps) in the first quarter of the next financial year.
USD/INR has witnessed a steep fall after a breakdown of the inventory distribution in which inventory is transferred from institutional investors to retail participants. The inventory adjustment formed in a range of 82.50-82.83 on an hourly scale. The 20-period Exponential Moving Average (EMA) at 82.36 is acting as a barricade for the US Dollar bulls.
The Relative Strength Index (RSI) (14) is oscillating in the bearish range of 20.00-40.00, indicating more weakness ahead.
Should the asset break below June 01 low at 82.23, Indian Rupee bulls would drag the asset toward the round-level support at 82.00 followed by May 04 high at 81.82.
In an alternate scenario, a decisive break above May 23 high at 82.97 will drive the asset toward 03 November 2022 high at 83.18 followed by all-time-high at 83.42.
Technical Levels: Supports and Resistances
USDINR currently trading at 82.3275 at the time of writing. Pair opened at 82.2893 and is trading with a change of 0.05 % .
| Overview | Overview.1 | |
|---|---|---|
| 0 | Today last price | 82.3275 |
| 1 | Today Daily Change | 0.0382 |
| 2 | Today Daily Change % | 0.0500 |
| 3 | Today daily open | 82.2893 |
The pair is trading below its 20 Daily moving average @ 82.4246, above its 50 Daily moving average @ 82.159 , above its 100 Daily moving average @ 82.184 and above its 200 Daily moving average @ 81.9109
| Trends | Trends.1 | |
|---|---|---|
| 0 | Daily SMA20 | 82.4246 |
| 1 | Daily SMA50 | 82.1590 |
| 2 | Daily SMA100 | 82.1840 |
| 3 | Daily SMA200 | 81.9109 |
The previous day high was 82.737 while the previous day low was 82.2675. The daily 38.2% Fib levels comes at 82.4469, expected to provide resistance. Similarly, the daily 61.8% fib level is at 82.5577, expected to provide resistance.
Note the levels of interest below:
- Pivot support is noted at 82.1255, 81.9617, 81.656
- Pivot resistance is noted at 82.5951, 82.9008, 83.0646
| Levels | Levels.1 |
|---|---|
| Previous Daily High | 82.7370 |
| Previous Daily Low | 82.2675 |
| Previous Weekly High | 82.9810 |
| Previous Weekly Low | 82.5302 |
| Previous Monthly High | 82.9810 |
| Previous Monthly Low | 81.6435 |
| Daily Fibonacci 38.2% | 82.4469 |
| Daily Fibonacci 61.8% | 82.5577 |
| Daily Pivot Point S1 | 82.1255 |
| Daily Pivot Point S2 | 81.9617 |
| Daily Pivot Point S3 | 81.6560 |
| Daily Pivot Point R1 | 82.5951 |
| Daily Pivot Point R2 | 82.9008 |
| Daily Pivot Point R3 | 83.0646 |
[/s2If]
Nehcap Expert Advisor
The NEHCAP MT4 EA is high quality professional trading system geared to generate returns without using GRID or martingales. Each trade has strict risk per trade parameter. The pairs under management include EURUSD, GBPUSD, AUDCAD, AUDNZD,GBPAUD, EURAUD, EURCAD, CHFJPY and many more.
The system is trading live: LIVE ACCOUNT TRACKING
You can run it free. Apply for a free trial and track our account. Buy the system or use profit share mechanism to generate returns on your MT4.
Join Our Telegram Group


