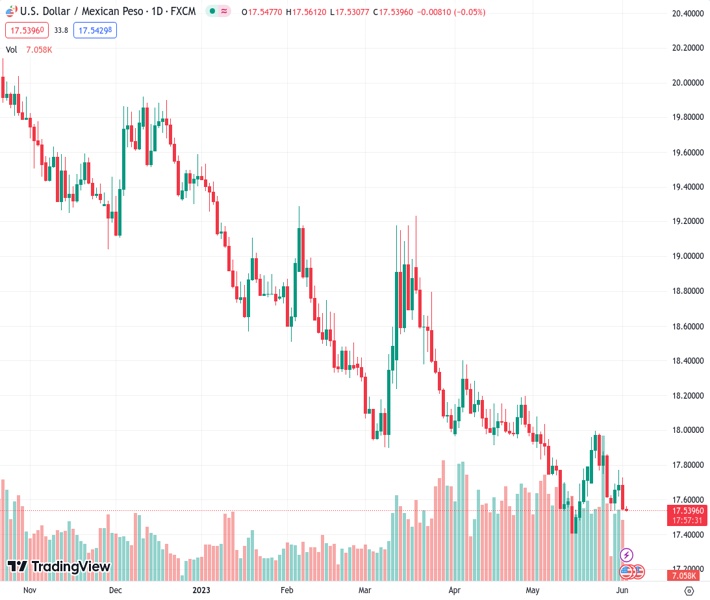
#USDMXN @ 17.5382 remains pressured at the lowest levels in two weeks after snapping two-day uptrend., @nehcap view: Limited downside expected (Pivot Orderbook analysis)
…
This is a premium post.
[s2If !current_user_can(access_s2member_level4)]Please register for FREE REGISTER to read full post below containing analysis. In case of any error or you think you are not able to read the full post below, please email us at support#nehcap.com [lwa][/s2If] [s2If current_user_can(access_s2member_level1)]
- USD/MXN remains pressured at the lowest levels in two weeks after snapping two-day uptrend.
- Clear downside break of short-term support line, bearish MACD signals favor Mexican Peso buyers.
- 50-SMA, descending resistance line from late April adds to the upside filters.
- Oscillators keep sellers hopeful but the downside appears bumpy.
The pair currently trades last at 17.5382.
The previous day high was 17.7286 while the previous day low was 17.5409. The daily 38.2% Fib levels comes at 17.6126, expected to provide resistance. Similarly, the daily 61.8% fib level is at 17.6569, expected to provide resistance.
USD/MXN prods intraday low near 17.54 as it run the previous day’s bearish play despite a limited audience on early Friday. In doing so, the Mexican Peso (MXN) pair extends the mid-week reversal from the 50-SMA, as well as the downside break of a two-week-old rising trend line.
Not only a U-turn from the short-term key moving average and the support line break but the bearish MACD signals also favor the USD/MXN sellers. However, the RSI (14) line remains below 50.0 and hence suggests limited downside room.
As a result, the multi-month low marked in May around 17.42 gains the USD/MXN pair seller’s attention.
In a case where the USD/MXN pair remains bearish past 17.42, it will witness a bumpy road toward the 17.00 psychological magnet. That said, the year 2016 low of 17.05 may act as an intermediate halt.
Alternatively, recovery moves need to cross the immediate support-turned-resistance, around 17.58 by the press time, to recall the USD/MXN buyers.
Even so, the 50-SMA level of around 17.73 may challenge the pair buyers before giving them control.
It’s worth noting that a convergence of the downward-sloping resistance line from late April and 61.8% Fibonacci retracement of April-May fall, around 17.90, quickly followed by the 18.00 round figure, acts as the last defense of the bears.
Trend: Limited downside expected
Technical Levels: Supports and Resistances
USDMXN currently trading at 17.544 at the time of writing. Pair opened at 17.5532 and is trading with a change of -0.05% % .
| Overview | Overview.1 | |
|---|---|---|
| 0 | Today last price | 17.544 |
| 1 | Today Daily Change | -0.0092 |
| 2 | Today Daily Change % | -0.05% |
| 3 | Today daily open | 17.5532 |
The pair remains strongly bearish on the daily time frame. It trades below the 20 SMA @ 17.687, 50 SMA 17.9287, 100 SMA @ 18.2672 and 200 SMA @ 18.9978.
| Trends | Trends.1 | |
|---|---|---|
| 0 | Daily SMA20 | 17.6870 |
| 1 | Daily SMA50 | 17.9287 |
| 2 | Daily SMA100 | 18.2672 |
| 3 | Daily SMA200 | 18.9978 |
The previous day high was 17.7286 while the previous day low was 17.5409. The daily 38.2% Fib levels comes at 17.6126, expected to provide resistance. Similarly, the daily 61.8% fib level is at 17.6569, expected to provide resistance.
Note the levels of interest below:
- Pivot support is noted at 17.4866, 17.4199, 17.2989
- Pivot resistance is noted at 17.6742, 17.7952, 17.8619
| Levels | Levels.1 |
|---|---|
| Previous Daily High | 17.7286 |
| Previous Daily Low | 17.5409 |
| Previous Weekly High | 17.9981 |
| Previous Weekly Low | 17.6165 |
| Previous Monthly High | 18.0780 |
| Previous Monthly Low | 17.4203 |
| Daily Fibonacci 38.2% | 17.6126 |
| Daily Fibonacci 61.8% | 17.6569 |
| Daily Pivot Point S1 | 17.4866 |
| Daily Pivot Point S2 | 17.4199 |
| Daily Pivot Point S3 | 17.2989 |
| Daily Pivot Point R1 | 17.6742 |
| Daily Pivot Point R2 | 17.7952 |
| Daily Pivot Point R3 | 17.8619 |
[/s2If]
Nehcap Expert Advisor
The NEHCAP MT4 EA is high quality professional trading system geared to generate returns without using GRID or martingales. Each trade has strict risk per trade parameter. The pairs under management include EURUSD, GBPUSD, AUDCAD, AUDNZD,GBPAUD, EURAUD, EURCAD, CHFJPY and many more.
The system is trading live: LIVE ACCOUNT TRACKING
You can run it free. Apply for a free trial and track our account. Buy the system or use profit share mechanism to generate returns on your MT4.
Join Our Telegram Group


