#USDCAD @ 1.34440 is continuously trading sideways below 1.3450 following the footprints of the USD Index. (Pivot Orderbook analysis)
…
This is a premium post.
[s2If !current_user_can(access_s2member_level4)]Please register for FREE REGISTER to read full post below containing analysis. In case of any error or you think you are not able to read the full post below, please email us at support#nehcap.com [lwa][/s2If] [s2If current_user_can(access_s2member_level1)]
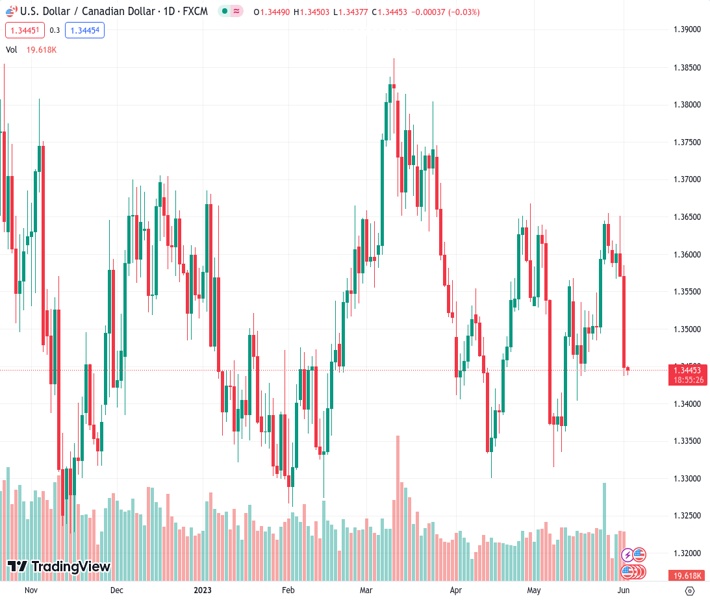
- USD/CAD is continuously trading sideways below 1.3450 following the footprints of the USD Index.
- Seventh straight contraction in US ISM Manufacturing PMI and dovish Fed commentary weigh heavily on the USD Index.
- USD/CAD witnessed a bloodbath after failing to surpass the supply zone plotted in a range of 1.3652-1.3668.
The pair currently trades last at 1.34440.
The previous day high was 1.3585 while the previous day low was 1.3436. The daily 38.2% Fib levels comes at 1.3493, expected to provide resistance. Similarly, the daily 61.8% fib level is at 1.3528, expected to provide resistance.
The USD/CAD pair is demonstrating back-and-forth action below 1.3450 in the Tokyo session. The Loonie asset has muted after a perpendicular sell-off as investors are awaiting the release of the United States Nonfarm Payrolls (NFP) data for further guidance.
The US Dollar Index (DXY) is consolidating below 103.60 after a sheer fall inspired by dovish commentary from Federal Reserve (Fed) policymakers and a seventh straight contraction in the United States ISM Manufacturing PMI data.
Meanwhile, the Canadian Dollar showed some strength after a strong recovery in the oil price. At the press time, the oil price was trading sideways after a solid recovery inspired by easing hawkish Fed bets. It is worth noting that Canada is the leading exporter of oil to the United States and higher oil prices should support the Canadian Dollar.
USD/CAD witnessed a bloodbath after failing to surpass the supply zone plotted in a range of 1.3652-1.3668 on a four-hour scale. A formation of the Double Top chart pattern that supports a bearish reversal added to the downside filters.
The Relative Strength Index (RSI) (14) has shifted into the bearish range of 20.00-40.00, indicating more weakness ahead.
A further breakdown below June 01 low at 1.3436 will expose the Loonie asset to the horizontal resistances plotted around May 16 low at 1.3404 and May 08 low at 1.3315.
Ina n alternate scenario, a fresh buy would come above May 26 high at 1.3655, which would drive the asset toward the round-level resistance at 1.3700 followed by March 27 high at 1.3745.
Technical Levels: Supports and Resistances
USDCAD currently trading at 1.3446 at the time of writing. Pair opened at 1.345 and is trading with a change of -0.03 % .
| Overview | Overview.1 | |
|---|---|---|
| 0 | Today last price | 1.3446 |
| 1 | Today Daily Change | -0.0004 |
| 2 | Today Daily Change % | -0.0300 |
| 3 | Today daily open | 1.3450 |
The pair remains strongly bearish on the daily time frame. It trades below the 20 SMA @ 1.3502, 50 SMA 1.3513, 100 SMA @ 1.3517 and 200 SMA @ 1.3505.
| Trends | Trends.1 | |
|---|---|---|
| 0 | Daily SMA20 | 1.3502 |
| 1 | Daily SMA50 | 1.3513 |
| 2 | Daily SMA100 | 1.3517 |
| 3 | Daily SMA200 | 1.3505 |
The previous day high was 1.3585 while the previous day low was 1.3436. The daily 38.2% Fib levels comes at 1.3493, expected to provide resistance. Similarly, the daily 61.8% fib level is at 1.3528, expected to provide resistance.
Note the levels of interest below:
- Pivot support is noted at 1.3396, 1.3342, 1.3247
- Pivot resistance is noted at 1.3544, 1.3639, 1.3693
| Levels | Levels.1 |
|---|---|
| Previous Daily High | 1.3585 |
| Previous Daily Low | 1.3436 |
| Previous Weekly High | 1.3655 |
| Previous Weekly Low | 1.3485 |
| Previous Monthly High | 1.3655 |
| Previous Monthly Low | 1.3315 |
| Daily Fibonacci 38.2% | 1.3493 |
| Daily Fibonacci 61.8% | 1.3528 |
| Daily Pivot Point S1 | 1.3396 |
| Daily Pivot Point S2 | 1.3342 |
| Daily Pivot Point S3 | 1.3247 |
| Daily Pivot Point R1 | 1.3544 |
| Daily Pivot Point R2 | 1.3639 |
| Daily Pivot Point R3 | 1.3693 |
[/s2If]
Nehcap Expert Advisor
The NEHCAP MT4 EA is high quality professional trading system geared to generate returns without using GRID or martingales. Each trade has strict risk per trade parameter. The pairs under management include EURUSD, GBPUSD, AUDCAD, AUDNZD,GBPAUD, EURAUD, EURCAD, CHFJPY and many more.
The system is trading live: LIVE ACCOUNT TRACKING
You can run it free. Apply for a free trial and track our account. Buy the system or use profit share mechanism to generate returns on your MT4.
Join Our Telegram Group


