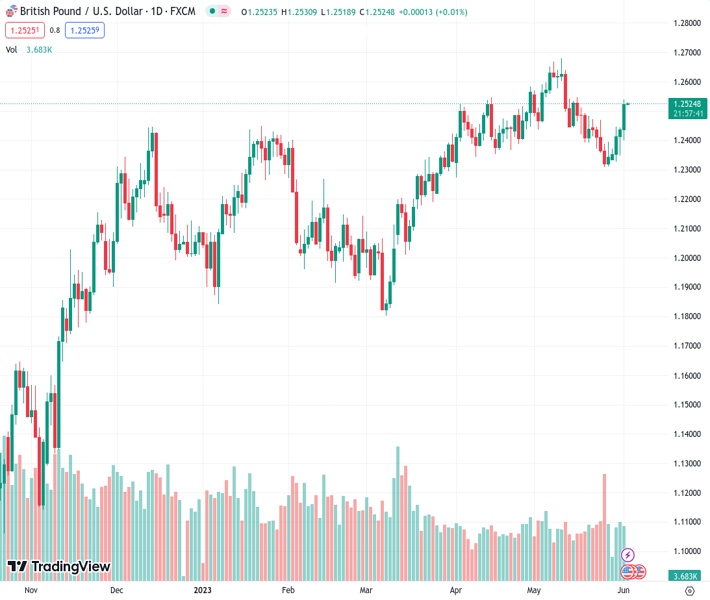
#GBPUSD @ 1.25290 is juggling in a narrow range above 1.2500 ahead of the US NFP data. (Pivot Orderbook analysis)
…
This is a premium post.
[s2If !current_user_can(access_s2member_level4)]Please register for FREE REGISTER to read full post below containing analysis. In case of any error or you think you are not able to read the full post below, please email us at support#nehcap.com [lwa][/s2If] [s2If current_user_can(access_s2member_level1)]
- GBP/USD is juggling in a narrow range above 1.2500 ahead of the US NFP data.
- Fed policymakers are divided over contracting US Manufacturing PMI vs. tight labor market conditions.
- GBP/USD is gathering strength for a breakout above the 61.8% Fibo retracement at 1.2539.
The pair currently trades last at 1.25290.
The previous day high was 1.2444 while the previous day low was 1.2348. The daily 38.2% Fib levels comes at 1.2408, expected to provide support. Similarly, the daily 61.8% fib level is at 1.2385, expected to provide support.
The GBP/USD pair is oscillating after a stalwart rally above the psychological resistance of 1.2500 in the early Tokyo session. The Cable has turned sideways as investors are confused that whether Federal Reserve (Fed) policymakers will focus on consistently contracting United States ISM Manufacturing PMI or tight labor market conditions while designing the monetary policy for June month.
On Thursday, the US ISM reported a seventh straight contraction in US factory activity due to higher interest rates while the Automatic Data Processing (ADP) agency reported an addition of 278K fresh payrolls against the consensus of 170K.
The US Dollar Index (DXY) showed a vertical fall after surrendering the crucial support of 104.00 and has now extended its downside below 103.60, at the time of writing.
GBP/USD is gathering strength for a breakout above the 61.8% Fibonacci retracement (plotted from May 10 high at 1.2680 to May 25 low at 1.2308) at 1.2539 on a two-hour scale.
Upward-sloping 20-period Exponential Moving Average (EMA) at 1.2468 indicates that the short-term trend is extremely bullish.
Also, the Relative Strength Index (RSI) (14) is oscillating in the bullish range of 60.00-80.00, which signals the bullish momentum has already been triggered.
For further upside, a confident break above May 16 high at 1.2547 will drive the Cable toward May 10 low at 1.2603 followed by May 10 high at 1.2680.
On the flip side, a breakdown below May 12 low at 1.2440 will drag the asset toward a 23.6% Fibo retracement near 1.2400 and May 31 low at 1.2348.
Technical Levels: Supports and Resistances
GBPUSD currently trading at 1.2526 at the time of writing. Pair opened at 1.244 and is trading with a change of 0.69 % .
| Overview | Overview.1 | |
|---|---|---|
| 0 | Today last price | 1.2526 |
| 1 | Today Daily Change | 0.0086 |
| 2 | Today Daily Change % | 0.6900 |
| 3 | Today daily open | 1.2440 |
The pair remains strongly bullish on the daily timeframe. It trades above its 20 SMA @ 1.2474, 50 SMA 1.2444, 100 SMA @ 1.2295 and 200 SMA @ 1.1987.
| Trends | Trends.1 | |
|---|---|---|
| 0 | Daily SMA20 | 1.2474 |
| 1 | Daily SMA50 | 1.2444 |
| 2 | Daily SMA100 | 1.2295 |
| 3 | Daily SMA200 | 1.1987 |
The previous day high was 1.2444 while the previous day low was 1.2348. The daily 38.2% Fib levels comes at 1.2408, expected to provide support. Similarly, the daily 61.8% fib level is at 1.2385, expected to provide support.
Note the levels of interest below:
- Pivot support is noted at 1.2377, 1.2315, 1.2281
- Pivot resistance is noted at 1.2474, 1.2507, 1.257
| Levels | Levels.1 |
|---|---|
| Previous Daily High | 1.2444 |
| Previous Daily Low | 1.2348 |
| Previous Weekly High | 1.2472 |
| Previous Weekly Low | 1.2308 |
| Previous Monthly High | 1.2680 |
| Previous Monthly Low | 1.2308 |
| Daily Fibonacci 38.2% | 1.2408 |
| Daily Fibonacci 61.8% | 1.2385 |
| Daily Pivot Point S1 | 1.2377 |
| Daily Pivot Point S2 | 1.2315 |
| Daily Pivot Point S3 | 1.2281 |
| Daily Pivot Point R1 | 1.2474 |
| Daily Pivot Point R2 | 1.2507 |
| Daily Pivot Point R3 | 1.2570 |
[/s2If]
Nehcap Expert Advisor
The NEHCAP MT4 EA is high quality professional trading system geared to generate returns without using GRID or martingales. Each trade has strict risk per trade parameter. The pairs under management include EURUSD, GBPUSD, AUDCAD, AUDNZD,GBPAUD, EURAUD, EURCAD, CHFJPY and many more.
The system is trading live: LIVE ACCOUNT TRACKING
You can run it free. Apply for a free trial and track our account. Buy the system or use profit share mechanism to generate returns on your MT4.
Join Our Telegram Group


