#GBPJPY @ 173.895 closed at its highest level since 2016 and reached overbought conditions (Pivot Orderbook analysis)
…
This is a premium post.
[s2If !current_user_can(access_s2member_level4)]Please register for FREE REGISTER to read full post below containing analysis. In case of any error or you think you are not able to read the full post below, please email us at support#nehcap.com [lwa][/s2If] [s2If current_user_can(access_s2member_level1)]
- GBP/JPY closed at its highest level since 2016 and reached overbought conditions
- UK’s S&P May’s Manufacturing PMI came in at 47.1 vs 46.9 expected
- The Yen weakened against its major rivals
The pair currently trades last at 173.895.
The previous day high was 173.65 while the previous day low was 172.53. The daily 38.2% Fib levels comes at 172.96, expected to provide support. Similarly, the daily 61.8% fib level is at 173.22, expected to provide support.
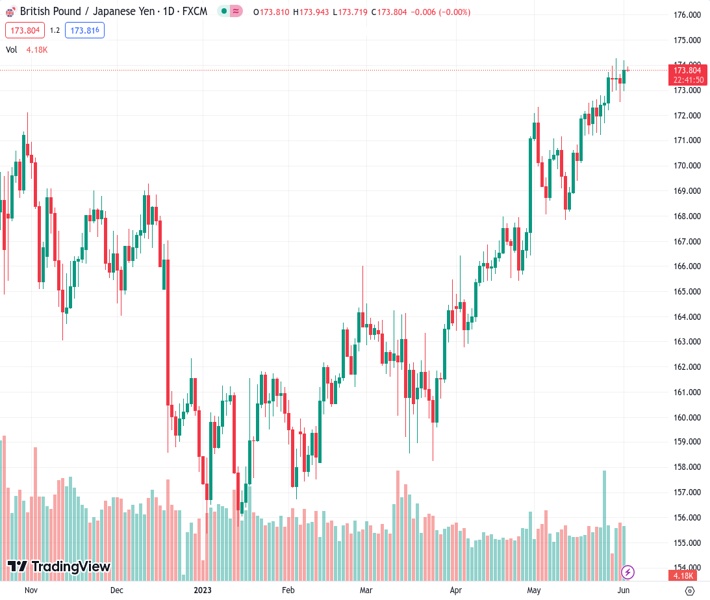
The GBP/JPY traded with gains around the 173.80 area in Thursday’s session. The Sterling Pound strengthened against its major rivals while the Japanese Yen weakened against the Euro, Swiss and the Australian Dollar. In addition, upbeat manufacturing PMI from the UK and yield divergence between the British and Japanese yields seem to propel the pair.
The British yields are on the upswing. The 10-year bond yield reached 4.16% and exhibited a gain of 0.86%. The 2-year yield stands at 4.32% with an increase of 0.32%, while the 5-year yield is at 4.09% having increased 0.86%. In contrast, the Japanese yields experienced a downturn across the curve, with the 2 and 5-year rates seeing losses of more than 5% applying further pressure on the pair.
For Friday’s session, both British and Japanese economic calendars will remain empty and attention should turn to the US Nonfarm Payrolls from May. It may have an impact on the expectations for the upcoming June 13-14 Federal Reserve (Fed) meeting.
According to the daily chart, the GBP/JPY holds a bullish outlook for the short term as the Relative Strength Index (RSI) and Moving Average Convergence Divergence (MACD) suggest that the buyers are in control while the pair trades above its main moving averages. However, the near overbought conditions of the pair may suggest a technical correction in the upcoming session.
The 172.50 zone is key for GBP/JPY to maintain its upside bias. If breached, we could see a more pronounced decline towards the psychological mark at 172.00 and 171.55 area where the 20-day Simple Moving Average (SMA) stands. Conversely, resistances line up at the 174.00 followed by the 174.30 and the 174.50 zone.
Technical Levels: Supports and Resistances
GBPJPY currently trading at 173.89 at the time of writing. Pair opened at 173.34 and is trading with a change of 0.32 % .
| Overview | Overview.1 | |
|---|---|---|
| 0 | Today last price | 173.89 |
| 1 | Today Daily Change | 0.55 |
| 2 | Today Daily Change % | 0.32 |
| 3 | Today daily open | 173.34 |
The pair remains strongly bullish on the daily timeframe. It trades above its 20 SMA @ 171.35, 50 SMA 167.96, 100 SMA @ 164.44 and 200 SMA @ 164.35.
| Trends | Trends.1 | |
|---|---|---|
| 0 | Daily SMA20 | 171.35 |
| 1 | Daily SMA50 | 167.96 |
| 2 | Daily SMA100 | 164.44 |
| 3 | Daily SMA200 | 164.35 |
The previous day high was 173.65 while the previous day low was 172.53. The daily 38.2% Fib levels comes at 172.96, expected to provide support. Similarly, the daily 61.8% fib level is at 173.22, expected to provide support.
Note the levels of interest below:
- Pivot support is noted at 172.7, 172.05, 171.57
- Pivot resistance is noted at 173.82, 174.3, 174.94
| Levels | Levels.1 |
|---|---|
| Previous Daily High | 173.65 |
| Previous Daily Low | 172.53 |
| Previous Weekly High | 173.74 |
| Previous Weekly Low | 171.20 |
| Previous Monthly High | 174.28 |
| Previous Monthly Low | 167.84 |
| Daily Fibonacci 38.2% | 172.96 |
| Daily Fibonacci 61.8% | 173.22 |
| Daily Pivot Point S1 | 172.70 |
| Daily Pivot Point S2 | 172.05 |
| Daily Pivot Point S3 | 171.57 |
| Daily Pivot Point R1 | 173.82 |
| Daily Pivot Point R2 | 174.30 |
| Daily Pivot Point R3 | 174.94 |
[/s2If]
Nehcap Expert Advisor
The NEHCAP MT4 EA is high quality professional trading system geared to generate returns without using GRID or martingales. Each trade has strict risk per trade parameter. The pairs under management include EURUSD, GBPUSD, AUDCAD, AUDNZD,GBPAUD, EURAUD, EURCAD, CHFJPY and many more.
The system is trading live: LIVE ACCOUNT TRACKING
You can run it free. Apply for a free trial and track our account. Buy the system or use profit share mechanism to generate returns on your MT4.
Join Our Telegram Group


