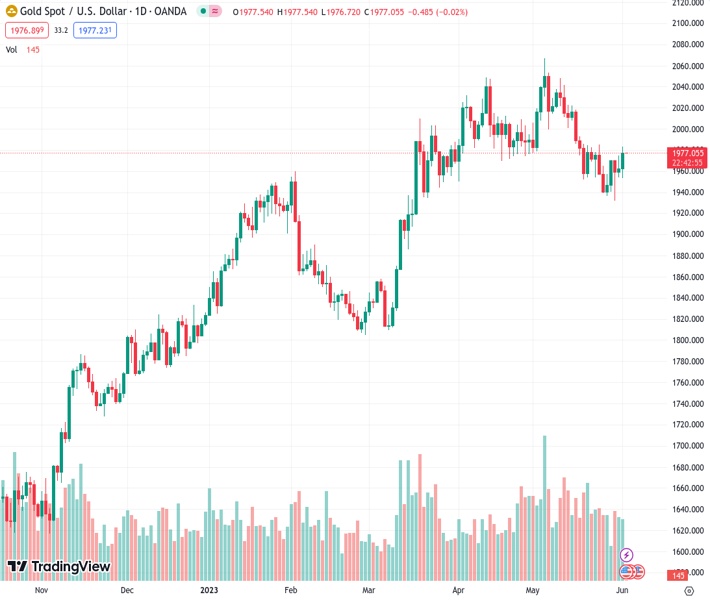
#XAUUSD @ 1,976.89 Gold Price eyes first weekly gain in four amid downbeat United States Treasury bond yields, US Dollar., @nehcap view: Limited upside expected (Pivot Orderbook analysis)
…
This is a premium post.
[s2If !current_user_can(access_s2member_level4)]Please register for FREE REGISTER to read full post below containing analysis. In case of any error or you think you are not able to read the full post below, please email us at support#nehcap.com [lwa][/s2If] [s2If current_user_can(access_s2member_level1)]
- Gold Price eyes first weekly gain in four amid downbeat United States Treasury bond yields, US Dollar.
- Market’s cautious optimism about US debt ceiling deal’s passage through Congress, easing hawkish Federal Reserve bets favor XAU/USD bulls.
- US Nonfarm Payrolls (NFP), Unemployment Rate need to portray tight job markets to prod the Gold Price.
The pair currently trades last at 1976.89.
The previous day high was 1974.83 while the previous day low was 1953.72. The daily 38.2% Fib levels comes at 1966.77, expected to provide support. Similarly, the daily 61.8% fib level is at 1961.78, expected to provide support.
Gold Price (XAU/USD) remains on the front foot at the weekly high, making rounds to $1,975-77 amid early Asian session on Friday following the two-day uptrend. With this, the yellow metal braces for the first weekly gains in four amid broad weakness in the United States Treasury bond yields and US Dollar. While trading the main catalysts, the market’s expectations of witnessing the Federal Reserve’s (Fed) rate hike pause in June gain major attention. Adding strength to the XAU/USD upside is the passage of the US debt-ceiling deal through the House of Representatives and the mixed US data. Furthermore, upbeat China PMI also favored the Gold buyers.
Moving on, the Gold traders should wait for the United States monthly employment report for fresh clues.
Gold Price grinds higher around the weekly top as the market’s pricing of the Federal Reserve (Fed) rate hike drops, from a 17 basis points (bps) in June on Wednesday to 7 bps on Thursday. Behind the latest move could be the mixed United States data and a lack of strong hawkish comments from the Fed Officials.
On Thursday, US ADP Employment Change eased to 278K in May from 291K prior (revised) but crossed the 170K market forecasts. On the same line, the weekly Initial Jobless Claims rose past 230K prior to 232K, versus 235K expected. Further, US ISM Manufacturing PMI eased to 46.9 in May compared to 47.0 anticipated and 47.1 previous readings whereas S&P Global Manufacturing PMI softened to 48.4 from 48.5 prior. Additionally, the US Employment Cost Index eased while consumer sentiment gauge improved but the details were unimpressive.
Elsewhere, Federal Reserve Bank of St. Louis President James Bullard recently published an analysis wherein the Fed hawk accepts that the prospects for continued disinflation are good but not guaranteed, and continued vigilance is required.
The US Republican-controlled House of Representatives recently passed the debt-ceiling bill and favored the market’s optimism as the ruling Democrats dominate in the Senate and can easily avoid the default now.
It’s worth noting that the upbeat China Caixin Manufacturing PMI adds strength to the XAU/USD’s upside momentum.
Looking forward, the US employment clues and the last round of the Fed talks ahead of the pre-FOMC blackout period for policymakers.
Also read: US May Nonfarm Payrolls Preview: Analyzing Gold price’s reaction to NFP surprises
Gold price extends recovery from the 100-DMA and a seven-month-old ascending support line, around $1,940 by the press time, to approach the 50-DMA hurdle surrounding $1,992.
Not only the U-turn from the key support line and DMA but a clear upside break of the previously important resistance line stretched from early May also keeps the XAU/USD buyers hopeful.
On the same line, the upbeat Relative Strength Index (RSI) line, placed at 14, as well as the receding bearish bias of the Moving Average Convergence and Divergence (MACD) indicator, add strength to the upside expectations of the Gold price.
That said, the 50-DMA breakout needs validation from the $2,000 round figure before approaching multiple resistances near $2,050.
Meanwhile, a convergence of the 100-DMA, the resistance-turned-support line and a multi-day-old rising trend line, near $1,938-40, appears an important challenge for the XAU/USD bears to conquer to regain control.
Following that, the Gold price south-run toward the peaks marked in early February and March, around $1,890 and $1,858 can’t be ruled out.
To sum up, the Gold Price appears well-set to recapture the $2,000 round figure.
Trend: Limited upside expected
Technical Levels: Supports and Resistances
XAUUSD currently trading at 1977.76 at the time of writing. Pair opened at 1962.66 and is trading with a change of 0.77 % .
| Overview | Overview.1 | |
|---|---|---|
| 0 | Today last price | 1977.76 |
| 1 | Today Daily Change | 15.10 |
| 2 | Today Daily Change % | 0.77 |
| 3 | Today daily open | 1962.66 |
The pair is trading below its 20 Daily moving average @ 1987.97, below its 50 Daily moving average @ 1992.15 , above its 100 Daily moving average @ 1937.59 and above its 200 Daily moving average @ 1833.6
| Trends | Trends.1 | |
|---|---|---|
| 0 | Daily SMA20 | 1987.97 |
| 1 | Daily SMA50 | 1992.15 |
| 2 | Daily SMA100 | 1937.59 |
| 3 | Daily SMA200 | 1833.60 |
The previous day high was 1974.83 while the previous day low was 1953.72. The daily 38.2% Fib levels comes at 1966.77, expected to provide support. Similarly, the daily 61.8% fib level is at 1961.78, expected to provide support.
Note the levels of interest below:
- Pivot support is noted at 1952.64, 1942.63, 1931.53
- Pivot resistance is noted at 1973.75, 1984.85, 1994.86
| Levels | Levels.1 |
|---|---|
| Previous Daily High | 1974.83 |
| Previous Daily Low | 1953.72 |
| Previous Weekly High | 1985.30 |
| Previous Weekly Low | 1936.77 |
| Previous Monthly High | 2079.76 |
| Previous Monthly Low | 1932.12 |
| Daily Fibonacci 38.2% | 1966.77 |
| Daily Fibonacci 61.8% | 1961.78 |
| Daily Pivot Point S1 | 1952.64 |
| Daily Pivot Point S2 | 1942.63 |
| Daily Pivot Point S3 | 1931.53 |
| Daily Pivot Point R1 | 1973.75 |
| Daily Pivot Point R2 | 1984.85 |
| Daily Pivot Point R3 | 1994.86 |
[/s2If]
Nehcap Expert Advisor
The NEHCAP MT4 EA is high quality professional trading system geared to generate returns without using GRID or martingales. Each trade has strict risk per trade parameter. The pairs under management include EURUSD, GBPUSD, AUDCAD, AUDNZD,GBPAUD, EURAUD, EURCAD, CHFJPY and many more.
The system is trading live: LIVE ACCOUNT TRACKING
You can run it free. Apply for a free trial and track our account. Buy the system or use profit share mechanism to generate returns on your MT4.
Join Our Telegram Group


