#USDCAD @ 1.34425 Dovish hints from Fed Governor Jefferson led to two-week lows. (Pivot Orderbook analysis)
…
This is a premium post.
[s2If !current_user_can(access_s2member_level4)]Please register for FREE REGISTER to read full post below containing analysis. In case of any error or you think you are not able to read the full post below, please email us at support#nehcap.com [lwa][/s2If] [s2If current_user_can(access_s2member_level1)]
- Dovish hints from Fed Governor Jefferson led to two-week USD/CAD lows.
- The recessionary US PMI trend clashes with robust Canadian GDP growth.
- Private sector hiring surge belied by tighter US labor market and rising jobless claims.
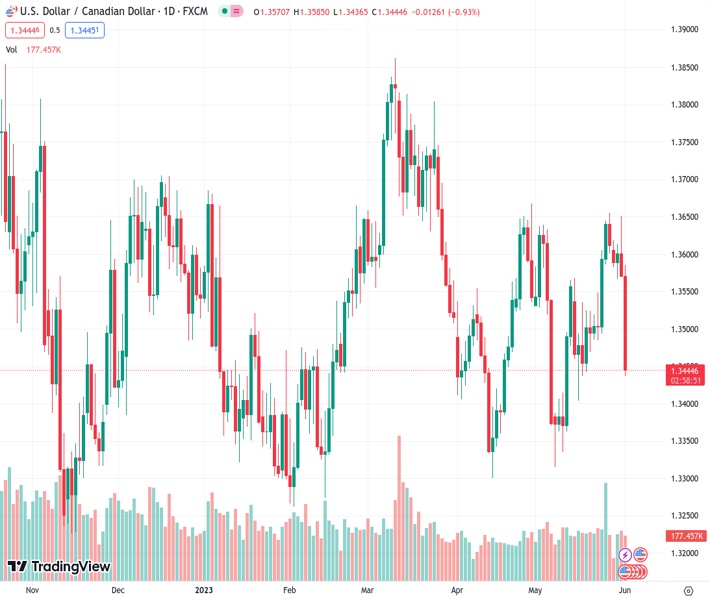
The pair currently trades last at 1.34425.
The previous day high was 1.3651 while the previous day low was 1.3569. The daily 38.2% Fib levels comes at 1.3601, expected to provide resistance. Similarly, the daily 61.8% fib level is at 1.362, expected to provide resistance.
USD/CAD plunged more than 100 pips from around the 1.3580s area, as Fed dovish comments took center stage while manufacturing activity in the United States (US) decelerated. That, alongside solid growth figures from Canada, sponsored the USD/CAD fall of more than 0.90%. The USD/CAD exchanges hands at 1.3440, trading around fresh two-week lows.
Market sentiment improved, as shown by Wall Street trading in the green. The Institute for Supply Management (ISM) revealed May PMI, which clocked in at 46.9, trailing April’s 47.1 and below a forecasted 47 – a recessionary signal, falling for a seven-straight month. The Fed’s aggressive tightening and sinking of new orders heavily burdened the PMI and the US Dollar.
The ADP Report indicated private sector hiring surged to 278K in May, surpassing 170K estimates but lagging behind April’s 291K. This underlines a tight labor market, further echoed by the rise in initial jobless claims to 232K – slightly below estimates but exceeding the prior week’s downwardly revised 230K.
Regarding US central bank speakers, on Wednesday, Fed Governor Philip Jefferson, backed by Harker, hinted at bypassing a rate hike at June’s meeting. Yet, Harker conceded that new data could shift his stance.
Recently, Harker reiterated Wednesday’s stance for skipping June “and see how it goes.” He added that it’s time to hit the stop button at least for one meeting so that the US central bank can assess the current economic situation.
Across the borders, the latest GDP figures in Canada showed the economy’s resilience, increasing investors’ speculations for a Bank of Canada (BoC) interest rate increase. The release of the S&P Global Manufacturing PMI for May showed that business activity decelerated, as the index dropped from 50.2 to 49.0 in May.
From a technical perspective, the USD/CAD is neutrally biased, though closing into the 200-day Exponential Moving Average (EMA) at 1.3417, the first support following the USD/CAD collapse. Should be said the Relative Strength Index (RSI) indicator portrays sellers gathering momentum, as well as the 3-day Rate of Change (RoC). But, with a flat slope, EMAs warrant caution, as the USD/CAD pair could be in a consolidation phase. For a bearish continuation, USD/CAD must claim the 200-day EMA, followed by the 1.3400 figure ahead of testing the May low of 1.3314. Conversely, the USD/CAD first resistance would be the 1.3500 figure, followed by the 100-day EMA at 13512. Next, resistance levels lie at the 50 and 20-day EMA, each at 1.3526 and 1.3531, respectively.
Technical Levels: Supports and Resistances
USDCAD currently trading at 1.3441 at the time of writing. Pair opened at 1.3574 and is trading with a change of -0.98 % .
| Overview | Overview.1 | |
|---|---|---|
| 0 | Today last price | 1.3441 |
| 1 | Today Daily Change | -0.0133 |
| 2 | Today Daily Change % | -0.9800 |
| 3 | Today daily open | 1.3574 |
The pair remains strongly bearish on the daily time frame. It trades below the 20 SMA @ 1.3507, 50 SMA 1.3518, 100 SMA @ 1.3517 and 200 SMA @ 1.3502.
| Trends | Trends.1 | |
|---|---|---|
| 0 | Daily SMA20 | 1.3507 |
| 1 | Daily SMA50 | 1.3518 |
| 2 | Daily SMA100 | 1.3517 |
| 3 | Daily SMA200 | 1.3502 |
The previous day high was 1.3651 while the previous day low was 1.3569. The daily 38.2% Fib levels comes at 1.3601, expected to provide resistance. Similarly, the daily 61.8% fib level is at 1.362, expected to provide resistance.
Note the levels of interest below:
- Pivot support is noted at 1.3545, 1.3516, 1.3464
- Pivot resistance is noted at 1.3627, 1.368, 1.3709
| Levels | Levels.1 |
|---|---|
| Previous Daily High | 1.3651 |
| Previous Daily Low | 1.3569 |
| Previous Weekly High | 1.3655 |
| Previous Weekly Low | 1.3485 |
| Previous Monthly High | 1.3655 |
| Previous Monthly Low | 1.3315 |
| Daily Fibonacci 38.2% | 1.3601 |
| Daily Fibonacci 61.8% | 1.3620 |
| Daily Pivot Point S1 | 1.3545 |
| Daily Pivot Point S2 | 1.3516 |
| Daily Pivot Point S3 | 1.3464 |
| Daily Pivot Point R1 | 1.3627 |
| Daily Pivot Point R2 | 1.3680 |
| Daily Pivot Point R3 | 1.3709 |
[/s2If]
Nehcap Expert Advisor
The NEHCAP MT4 EA is high quality professional trading system geared to generate returns without using GRID or martingales. Each trade has strict risk per trade parameter. The pairs under management include EURUSD, GBPUSD, AUDCAD, AUDNZD,GBPAUD, EURAUD, EURCAD, CHFJPY and many more.
The system is trading live: LIVE ACCOUNT TRACKING
You can run it free. Apply for a free trial and track our account. Buy the system or use profit share mechanism to generate returns on your MT4.
Join Our Telegram Group


