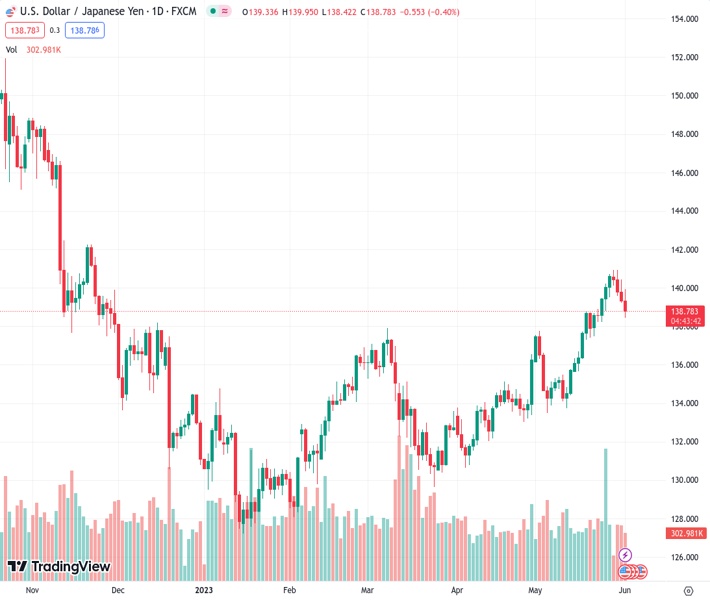
#USDJPY @ 138.768 The sets a fourth consecutive day of losses and trades around the 138.80 area. (Pivot Orderbook analysis)
…
This is a premium post.
[s2If !current_user_can(access_s2member_level4)]Please register for FREE REGISTER to read full post below containing analysis. In case of any error or you think you are not able to read the full post below, please email us at support#nehcap.com [lwa][/s2If] [s2If current_user_can(access_s2member_level1)]
- The USD/JPY sets a fourth consecutive day of losses and trades around the 138.80 area.
- Downward revision of Unit Labor Cost and weak ISM PMIs increased the dovish bets on the Fed.
- Declining US bond yields weigh on the US Dollar.
The pair currently trades last at 138.768.
The previous day high was 140.43 while the previous day low was 139.24. The daily 38.2% Fib levels comes at 139.69, expected to provide resistance. Similarly, the daily 61.8% fib level is at 139.97, expected to provide resistance.
The USD/JPY continues to decline and fell to a low since May 24 as the weak US Dollar, driven by poor ISM PMIs and lower Q1 Unit Labor Cost, lead markets to anticipate a higher likelihood of no rate hike by the Fed at the June 13-14 meeting. In that sense, the decline in the US bond yields favors the downward trajectory of the pair.
US bond yields decline after US data
The Automatic Processing Inc. reported that the US economy added 278k jobs in May (MoM) above the 170k expected by the markets. However the figure managed to decelerate from its previous figure of 291k in April. On the other hand, Unit Labor Costs in Q1 were up by 4.2%, revised from 6.3%. Furthermore, the Institute for Supply Management (ISM) showed that the Manufacturing PMI from May came in at 46.9 vs the 47 expected from the previous 47.1.
In that sense, as the economic activity in the US continues to weaken while the Fed maintains its target rate at a considerably restrictive level, markets now discount higher possibilities of the Fed not hiking in the next meeting on June 13-14. As a reaction, US bond yields declined across the board with shorter-term rates seeing more than 1% declines on the day and applied further selling pressure on the US Dollar.
In that sense, according to the CME FedWatch tool, investors are betting on 71.6% probabilities on the Fed not hiking in their next meeting in June and maintaining the target rate at 5.00%-5.25%.
For Friday’s session, the US Nonfarm payrolls (NFP) for May from are expected to show an increase of 190K below the previous 253K while hourly earnings to stagnate at 0.4% and the Unemployment Rate to slightly increase to 3.5%.
On the 4-hour chart, indicators fell to negative territory indicating that the bears have the upperhand for the immediate short term. It’s worth mentioning that the Relative Strength Index (RSI) indicator is approaching the oversold threshold and may suggest that some consolidation may be incoming.
In case the pair consolidates losses, the upcoming resistance for USD/JPY is seen at the level at 139.00 level, followed by the zone at 140.50 and the psychological mark at 141.00. On the other hand,if the Ninja loses ground, immediate support levels are seen at the 138.90 zone, followed by the 138.50 level and the psychological mark at 138.00.
Technical Levels: Supports and Resistances
USDJPY currently trading at 138.75 at the time of writing. Pair opened at 139.34 and is trading with a change of -0.42 % .
| Overview | Overview.1 | |
|---|---|---|
| 0 | Today last price | 138.75 |
| 1 | Today Daily Change | -0.59 |
| 2 | Today Daily Change % | -0.42 |
| 3 | Today daily open | 139.34 |
The pair remains strongly bullish on the daily timeframe. It trades above its 20 SMA @ 137.38, 50 SMA 134.97, 100 SMA @ 133.74 and 200 SMA @ 137.27.
| Trends | Trends.1 | |
|---|---|---|
| 0 | Daily SMA20 | 137.38 |
| 1 | Daily SMA50 | 134.97 |
| 2 | Daily SMA100 | 133.74 |
| 3 | Daily SMA200 | 137.27 |
The previous day high was 140.43 while the previous day low was 139.24. The daily 38.2% Fib levels comes at 139.69, expected to provide resistance. Similarly, the daily 61.8% fib level is at 139.97, expected to provide resistance.
Note the levels of interest below:
- Pivot support is noted at 138.91, 138.48, 137.72
- Pivot resistance is noted at 140.1, 140.86, 141.29
| Levels | Levels.1 |
|---|---|
| Previous Daily High | 140.43 |
| Previous Daily Low | 139.24 |
| Previous Weekly High | 140.72 |
| Previous Weekly Low | 137.49 |
| Previous Monthly High | 140.93 |
| Previous Monthly Low | 133.50 |
| Daily Fibonacci 38.2% | 139.69 |
| Daily Fibonacci 61.8% | 139.97 |
| Daily Pivot Point S1 | 138.91 |
| Daily Pivot Point S2 | 138.48 |
| Daily Pivot Point S3 | 137.72 |
| Daily Pivot Point R1 | 140.10 |
| Daily Pivot Point R2 | 140.86 |
| Daily Pivot Point R3 | 141.29 |
[/s2If]
Nehcap Expert Advisor
The NEHCAP MT4 EA is high quality professional trading system geared to generate returns without using GRID or martingales. Each trade has strict risk per trade parameter. The pairs under management include EURUSD, GBPUSD, AUDCAD, AUDNZD,GBPAUD, EURAUD, EURCAD, CHFJPY and many more.
The system is trading live: LIVE ACCOUNT TRACKING
You can run it free. Apply for a free trial and track our account. Buy the system or use profit share mechanism to generate returns on your MT4.
Join Our Telegram Group


