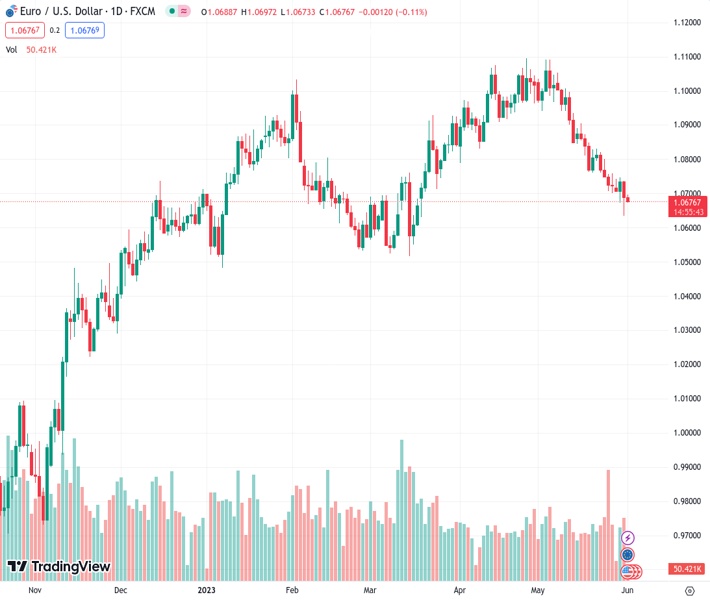
#EURUSD @ 1.06750 is oscillating below 1.0700 as the USD Index has climbed above the immediate resistance of 104.30. (Pivot Orderbook analysis)
…
This is a premium post.
[s2If !current_user_can(access_s2member_level4)]Please register for FREE REGISTER to read full post below containing analysis. In case of any error or you think you are not able to read the full post below, please email us at support#nehcap.com [lwa][/s2If] [s2If current_user_can(access_s2member_level1)]
- EUR/USD is oscillating below 1.0700 as the USD Index has climbed above the immediate resistance of 104.30.
- Federal Reserve policymakers are divided about interest rate guidance, which are creating chaos in financial markets.
- European Central Bank Muller is confident that the central bank will hike by 25 bps more than once as core inflation is still stubborn.
- EUR/USD is expected to retrace the entire Fibonacci tool placement plotted from March 15 low at 1.0516 to April 26 high at 1.1095.
The pair currently trades last at 1.06750.
The previous day high was 1.0736 while the previous day low was 1.0635. The daily 38.2% Fib levels comes at 1.0674, expected to provide support. Similarly, the daily 61.8% fib level is at 1.0697, expected to provide resistance.
EUR/USD is consolidating in a narrow range below the round-level resistance of 1.0700 in the early European session. The major currency pair is expected to show a power-pack action ahead of the release of the Eurozone Inflation and United States Employment data.
S&P500 futures have posted decent gains in Asia amid a recovery in the risk-taking capability of investors. The market participants dumped US equities on Wednesday amid cautious market mood-inspired by soaring expectations of one more interest rate hike from the Federal Reserve (Fed).
The US Dollar Index (DXY) is gathering strength for fitting above the immediate resistance of 104.30 as the risk-aversion theme underpinned by investors is improving its appeal. The USD Index is stabilizing after a sell-off move as the context of the US debt-ceiling bill is fading after getting clearance from Congress. A recovery move in the USD Index has dampened the demand for US government bonds. This has led to a jump in 10-year US Treasury yields to near 3.67%.
After the release of solid US job market data, investors are keeping an eye on US Employment, which will provide wholesome condition of labor market. Before US Nonfarm Payrolls (NFP) data, investors will wait for the release of the Automatic Data Processing (ADP) Employment Change (May). The street is anticipating a fresh addition of 170K personnel in labor market lower than the prior addition of 296K recorded for April. Consideration of the labor market data is crucial for the Federal Reserve before building a stance for the interest rate policy. It is highly expected that upbeat labor additions along with solid Job Openings will bolster the case of further policy-tightening by the Federal Reserve.
In addition to US ADP Employment Change, ISM Manufacturing PMI (May) will also remain in the spotlight. As per the preliminary report, Manufacturing PMI is expected to soften marginally to 47.0 vs. the former release of 47.1. A figure below 50.0 is considered a contraction in factory activities and the May month contraction could be the seventh consecutive contraction in the United States economy.
While New Orders Index that indicates forward demand is expected to drop to 44.9 from the prior release of 45.7. This could weigh severe pressure on the US Dollar.
Considering the fact that, US consumer spending has remained resilient in April, labor market conditions are still healthy, and April inflation figures remained stubborn, Federal Reserve could continue tightening policy further to keep its side in full strength in the battle against sticky inflation. However, Federal Reserve policymakers are divided about interest rate guidance, which is creating chaos in financial markets.
Cleveland Federal Reserve Bank President, Loretta Mester, in an interview with Financial Times, cited “I don’t really see a compelling reason to pause — meaning wait until you get more evidence to decide what to do.” While Federal Reserve Governor Philip Jefferson said in a speech on Wednesday that pausing rate hikes at the next Federal Open Market Committee (FOMC) meeting would offer time to analyze more data before making a decision about the extent of additional tightening. He added that a pause does not mean that rates peaked.
This week, the release of preliminary Germany, Spain, and France Harmonized Index of Consumer Prices (HICP) conveyed that inflationary pressures have softened more than expected in May led by lower energy prices and stagnant retail demand. Monthly headline figures from Spain and Germany have registered deflation, which has trimmed the odds of long-term hawkish European Central Bank (ECB) bets. An all-around decline in Germany, Spain, and France’s inflation numbers indicates that Eurozone inflation would also soften dramatically.
However, European Central Bank policymaker Madis Muller cited on Wednesday, “It is very likely that the central bank will hike by 25 bps more than once as core inflation is still stubborn.” Also, European Central Bank President Christine Lagarde stated in the last monetary policy meeting that more than one interest rate hike is appropriate.
EUR/USD is expected to retrace the entire Fibonacci tool placement plotted from March 15 low at 1.0516 to April 26 high at 1.1095 on a four-hour scale. The major currency pair is still auctioning in the Falling Channel chart pattern in which each pullback is considered as a selling opportunity.
The Relative Strength Index (RSI) (14) is struggling to shift into the 40.00-60.00 range from the bearish range of 20.00-40.00, indicating strength in the US Dollar bulls
Technical Levels: Supports and Resistances
EURUSD currently trading at 1.0682 at the time of writing. Pair opened at 1.0689 and is trading with a change of -0.07 % .
| Overview | Overview.1 | |
|---|---|---|
| 0 | Today last price | 1.0682 |
| 1 | Today Daily Change | -0.0007 |
| 2 | Today Daily Change % | -0.0700 |
| 3 | Today daily open | 1.0689 |
The pair is trading below its 20 Daily moving average @ 1.0841, below its 50 Daily moving average @ 1.0899 , below its 100 Daily moving average @ 1.0815 and above its 200 Daily moving average @ 1.0494
| Trends | Trends.1 | |
|---|---|---|
| 0 | Daily SMA20 | 1.0841 |
| 1 | Daily SMA50 | 1.0899 |
| 2 | Daily SMA100 | 1.0815 |
| 3 | Daily SMA200 | 1.0494 |
The previous day high was 1.0736 while the previous day low was 1.0635. The daily 38.2% Fib levels comes at 1.0674, expected to provide support. Similarly, the daily 61.8% fib level is at 1.0697, expected to provide resistance.
Note the levels of interest below:
- Pivot support is noted at 1.0638, 1.0586, 1.0537
- Pivot resistance is noted at 1.0738, 1.0787, 1.0838
| Levels | Levels.1 |
|---|---|
| Previous Daily High | 1.0736 |
| Previous Daily Low | 1.0635 |
| Previous Weekly High | 1.0831 |
| Previous Weekly Low | 1.0702 |
| Previous Monthly High | 1.1092 |
| Previous Monthly Low | 1.0635 |
| Daily Fibonacci 38.2% | 1.0674 |
| Daily Fibonacci 61.8% | 1.0697 |
| Daily Pivot Point S1 | 1.0638 |
| Daily Pivot Point S2 | 1.0586 |
| Daily Pivot Point S3 | 1.0537 |
| Daily Pivot Point R1 | 1.0738 |
| Daily Pivot Point R2 | 1.0787 |
| Daily Pivot Point R3 | 1.0838 |
[/s2If]
Nehcap Expert Advisor
The NEHCAP MT4 EA is high quality professional trading system geared to generate returns without using GRID or martingales. Each trade has strict risk per trade parameter. The pairs under management include EURUSD, GBPUSD, AUDCAD, AUDNZD,GBPAUD, EURAUD, EURCAD, CHFJPY and many more.
The system is trading live: LIVE ACCOUNT TRACKING
You can run it free. Apply for a free trial and track our account. Buy the system or use profit share mechanism to generate returns on your MT4.
Join Our Telegram Group
")


