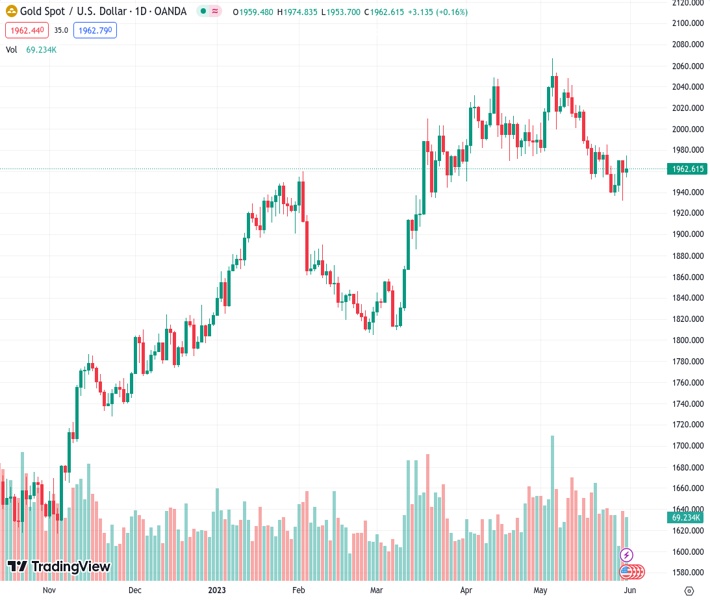
#XAUUSD @ 1964.22 Amid the uncertainty, the gold price stays above the $1960 mark, even preparing for over 1.3% monthly losses in May. (Pivot Orderbook analysis)
…
This is a premium post.
[s2If !current_user_can(access_s2member_level4)]Please register for FREE REGISTER to read full post below containing analysis. In case of any error or you think you are not able to read the full post below, please email us at support#nehcap.com [lwa][/s2If] [s2If current_user_can(access_s2member_level1)]
- Amid the uncertainty, the gold price stays above the $1960 mark, even preparing for over 1.3% monthly losses in May.
- Expectations of resolving the US debt ceiling issue spark a dip in US Treasury bond yields, offering a lift to the XAU/USD price.
- Dovish tones from Fed officials and robust US job openings data paint a mixed economic picture, potentially impacting gold’s future trajectory.
The pair currently trades last at 1964.22.
The previous day high was 1963.56 while the previous day low was 1932.12. The daily 38.2% Fib levels comes at 1951.55, expected to provide support. Similarly, the daily 61.8% fib level is at 1944.13, expected to provide support.
Gold price advances during the day but remains set to achieve monthly losses of more than 1.30% in May, portraying modest gains, and is trading back above the $1960 area. Factors like confidence for removing the debt ceiling in the United States (US), with the US House set for a vote on Wednesday night, spurred a plunge in US Treasury bond yields, a tailwind for XAU/USD prices.
The US House of Representatives held a procedural vote, “which allows for the start of the debate and then a vote on the bill itself, passed by a vote of 241-187, with 52 Democrats needed to overcome the opposition of 29 Republicans,” according to Reuters.
US bond yields dropped on investors’ trust in US politicians. The US 2-year Treasury note plummeted 20 bps in the last few days, from around 4.60% to 4.409%. As shown by US 10-year TIPS, US real yields remained unchanged compared to Tuesday’s session at 1.483%, a headwind for the US Dollar (USD).
In early data, the labor market in the United States is showing its resilience, as revealed by the JOLTs report, with job openings crushing estimates of 9.375M, expanding came at a 10.1M pace in April, signaling the tightness of the labor market.
Additionally, dovish comments from the US Federal Reserve (Fed) nominee for Vice-Chairman Philip Jefferson, open to skipping a rate hike at the upcoming June meeting, put additional pressure on US bond yields, with the swaps market estimating a 30% chance for a 25 bps rate hike in June.
Of late, echoing some of his comments was Philadelphia’s Fed President Patrick Harker commenting that he’s inclined to “skip” a rate hike in June. Nonetheless added that incoming data “may change my mind.”
In the latest data, the Fed’s Beige Book revealed that inflation had slowed and that “expectations for future growth deteriorated a little.”
XAU/USD remains neutrally biased, slightly tilted upwards but cushioned upwards, in the confluence of the 50 and 20-day Exponential Moving Averages (EMAs) each at $1971.39 and $1975.01, respectively. Downwards, the yellow metal will clash with the 100-day EMA at 1935.17 before challenging the $1900 figure. Once cleared, sellers could drag Gold spot prices toward the 200-day EMA at $1885.43.
Technical Levels: Supports and Resistances
XAUUSD currently trading at 1962.66 at the time of writing. Pair opened at 1959.28 and is trading with a change of 0.17 % .
| Overview | Overview.1 | |
|---|---|---|
| 0 | Today last price | 1962.66 |
| 1 | Today Daily Change | 3.38 |
| 2 | Today Daily Change % | 0.17 |
| 3 | Today daily open | 1959.28 |
The pair is trading below its 20 Daily moving average @ 1991.79, below its 50 Daily moving average @ 1991.7 , above its 100 Daily moving average @ 1936.74 and above its 200 Daily moving average @ 1832.52
| Trends | Trends.1 | |
|---|---|---|
| 0 | Daily SMA20 | 1991.79 |
| 1 | Daily SMA50 | 1991.70 |
| 2 | Daily SMA100 | 1936.74 |
| 3 | Daily SMA200 | 1832.52 |
The previous day high was 1963.56 while the previous day low was 1932.12. The daily 38.2% Fib levels comes at 1951.55, expected to provide support. Similarly, the daily 61.8% fib level is at 1944.13, expected to provide support.
Note the levels of interest below:
- Pivot support is noted at 1939.75, 1920.21, 1908.31
- Pivot resistance is noted at 1971.19, 1983.09, 2002.63
| Levels | Levels.1 |
|---|---|
| Previous Daily High | 1963.56 |
| Previous Daily Low | 1932.12 |
| Previous Weekly High | 1985.30 |
| Previous Weekly Low | 1936.77 |
| Previous Monthly High | 2048.75 |
| Previous Monthly Low | 1949.83 |
| Daily Fibonacci 38.2% | 1951.55 |
| Daily Fibonacci 61.8% | 1944.13 |
| Daily Pivot Point S1 | 1939.75 |
| Daily Pivot Point S2 | 1920.21 |
| Daily Pivot Point S3 | 1908.31 |
| Daily Pivot Point R1 | 1971.19 |
| Daily Pivot Point R2 | 1983.09 |
| Daily Pivot Point R3 | 2002.63 |
[/s2If]
Nehcap Expert Advisor
The NEHCAP MT4 EA is high quality professional trading system geared to generate returns without using GRID or martingales. Each trade has strict risk per trade parameter. The pairs under management include EURUSD, GBPUSD, AUDCAD, AUDNZD,GBPAUD, EURAUD, EURCAD, CHFJPY and many more.
The system is trading live: LIVE ACCOUNT TRACKING
You can run it free. Apply for a free trial and track our account. Buy the system or use profit share mechanism to generate returns on your MT4.
Join Our Telegram Group
")


