#EURJPY @ 148.882 retreats to two-week low amid Euro weakness (Pivot Orderbook analysis)
…
This is a premium post.
[s2If !current_user_can(access_s2member_level4)]Please register for FREE REGISTER to read full post below containing analysis. In case of any error or you think you are not able to read the full post below, please email us at support#nehcap.com [lwa][/s2If] [s2If current_user_can(access_s2member_level1)]
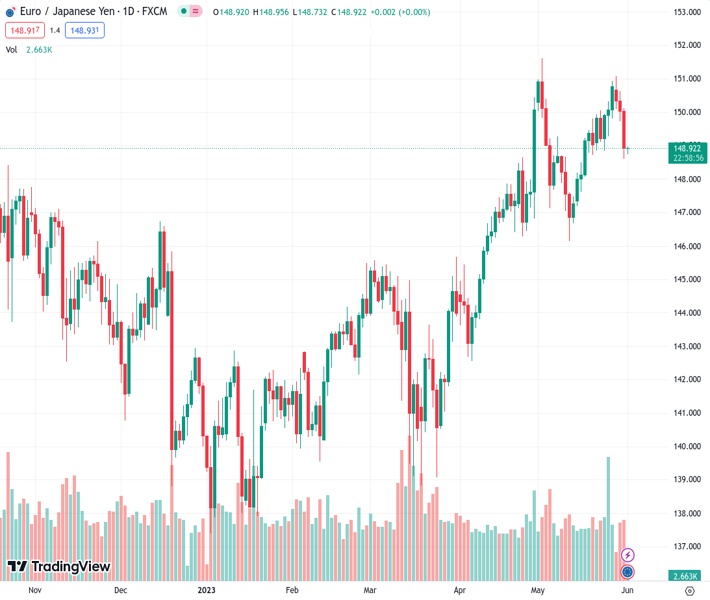
The pair currently trades last at 148.882.
The previous day high was 150.63 while the previous day low was 149.74. The daily 38.2% Fib levels comes at 150.08, expected to provide resistance. Similarly, the daily 61.8% fib level is at 150.29, expected to provide resistance.
The EUR/JPY fell to its lowest level since May 17 as weak inflation figures released by Germany and Spain from May made the Euro bulls lose interest in Wednesday’s session. On the other hand, the latest Japanese economic data released in the early Asian session came in weak, limiting the Yen’s upside potential.
The May data for the German Harmonized Index of Consumer Prices (HICP) indicated a deceleration to 6.3% year-on-year (YoY), down from the previous reading of 7.6% and below the consensus forecast of 6.8%. Similarly, Spain reported a decrease in its HICP to 2.9%, lower than the expected 3.4%. In that sense, the shorter-term German bond yields declined with the 2- and 10-year bond rates, seeing more than a 2% decrease while the 5-year yield managed to increase slightly . On the other hand, Japanese rates decreased, with the 5-year yield seeing a 12% decline on the day, and applied further pressure on the Yen.
Anticipated data for Thursday indicates a potential decline in the EU’s HICP and a contraction in German retail sales, signaling a weakening economy. If inflation continues to decrease, there is a possibility that the ECB might adopt a less strict monetary policy stance, which could negatively impact on the Euro.
On the other hand, Japan reported that Industrial Production unexpectedly contracted in the month of April while Retail Sales from the same month also failed to live up to the market expectations, contracting 1.2% vs the consensus which expected a stagnation. The Large Retailer Sales was the only economic report which surpassed expectations, coming in at 4.8% MoM, in April vs the 3.8% expected.
According to the daily chart, the EUR/JPY holds a bearish outlook for the short term as the Relative Strength Index (RSI) and Moving Average Convergence Divergence (MACD) suggest that the sellers are in control while the pair trades below its main moving averages.
The 20-day Simple Moving Average (SMA) at 148.80 level remains the key support level for EUR/JPY. If broken, the 148.50 area and 148.00 zone could come into play. Alternatively, a move above the 149.30 zone would suggest a boost for the pair’s upside momentum, with next resistances at the 149.50 area and 149.80 level.
Technical Levels: Supports and Resistances
EURJPY currently trading at 148.86 at the time of writing. Pair opened at 150.06 and is trading with a change of -0.8 % .
| Overview | Overview.1 | |
|---|---|---|
| 0 | Today last price | 148.86 |
| 1 | Today Daily Change | -1.20 |
| 2 | Today Daily Change % | -0.80 |
| 3 | Today daily open | 150.06 |
The pair is trading below its 20 Daily moving average @ 148.92, above its 50 Daily moving average @ 146.97 , above its 100 Daily moving average @ 144.57 and above its 200 Daily moving average @ 143.8
| Trends | Trends.1 | |
|---|---|---|
| 0 | Daily SMA20 | 148.92 |
| 1 | Daily SMA50 | 146.97 |
| 2 | Daily SMA100 | 144.57 |
| 3 | Daily SMA200 | 143.80 |
The previous day high was 150.63 while the previous day low was 149.74. The daily 38.2% Fib levels comes at 150.08, expected to provide resistance. Similarly, the daily 61.8% fib level is at 150.29, expected to provide resistance.
Note the levels of interest below:
- Pivot support is noted at 149.66, 149.25, 148.76
- Pivot resistance is noted at 150.55, 151.03, 151.44
| Levels | Levels.1 |
|---|---|
| Previous Daily High | 150.63 |
| Previous Daily Low | 149.74 |
| Previous Weekly High | 150.94 |
| Previous Weekly Low | 148.84 |
| Previous Monthly High | 150.44 |
| Previous Monthly Low | 142.55 |
| Daily Fibonacci 38.2% | 150.08 |
| Daily Fibonacci 61.8% | 150.29 |
| Daily Pivot Point S1 | 149.66 |
| Daily Pivot Point S2 | 149.25 |
| Daily Pivot Point S3 | 148.76 |
| Daily Pivot Point R1 | 150.55 |
| Daily Pivot Point R2 | 151.03 |
| Daily Pivot Point R3 | 151.44 |
[/s2If]
Nehcap Expert Advisor
The NEHCAP MT4 EA is high quality professional trading system geared to generate returns without using GRID or martingales. Each trade has strict risk per trade parameter. The pairs under management include EURUSD, GBPUSD, AUDCAD, AUDNZD,GBPAUD, EURAUD, EURCAD, CHFJPY and many more.
The system is trading live: LIVE ACCOUNT TRACKING
You can run it free. Apply for a free trial and track our account. Buy the system or use profit share mechanism to generate returns on your MT4.
Join Our Telegram Group
")


