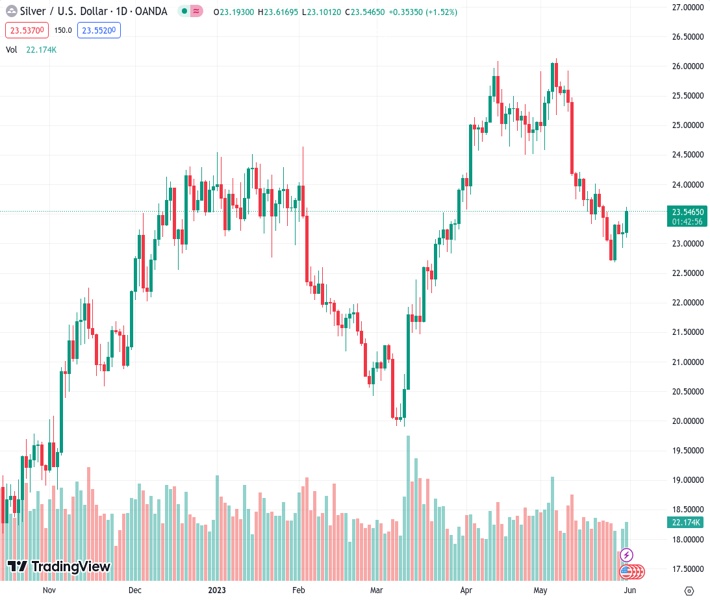
#XAGUSD @ 23.543 ascends past the 100-day EMA, powered by dovish remarks from Fed officials and reduced US Treasury yields. (Pivot Orderbook analysis)
…
This is a premium post.
[s2If !current_user_can(access_s2member_level4)]Please register for FREE REGISTER to read full post below containing analysis. In case of any error or you think you are not able to read the full post below, please email us at support#nehcap.com [lwa][/s2If] [s2If current_user_can(access_s2member_level1)]
- XAG/USD ascends past the 100-day EMA, powered by dovish remarks from Fed officials and reduced US Treasury yields.
- The technical outlook indicates potential resistance at 20-day and 50-day EMA, respectively, and support at 100-day and 200-day EMAs
- Further upside is expected based on the RSI and 3-period RoC, although key pivot points and daily highs need to be breached for significant gain.
The pair currently trades last at 23.543.
The previous day high was 23.34 while the previous day low was 22.93. The daily 38.2% Fib levels comes at 23.19, expected to provide support. Similarly, the daily 61.8% fib level is at 23.09, expected to provide support.
Silver price climbs past the 100-day Exponential Moving Average (EMA) and trades back above the $23.50 area, sponsored by several factors. Firstly, US Federal Reserve (Fed) Vice-Chairman nominee Philip Jefferson delivered dovish remarks alongside Philadelphia Fed’s Patrick Harker, while confidence about passing the US debt-ceiling bill triggered a fall in US Treasury bond yields.
From a daily chart perspective, XAG/USD is neutral to upward biased, capped on the upside by the confluence of two daily EMAs: the 20-day at $23.80 and the 50-day at $23.93. Upside risks lie above those levels, exposing the $24.00 figure. Conversely, XAG/USD sellers claiming the 100-day EMA at $23.46 could threaten to challenge the 200-day EMA at $22.84 for the third time.
The XAG/USD hourly chart indicates the white metal is upward biased but facing solid resistance at the R2 pivot point at 23.54, with upside risks at the May 23 daily high of 23.63. A breach of the latter, XAG/USD could climb toward the May 22 high of $23.91. Conversely, the XAG/USD first support would be the R1 daily pivot at $23.36 before slumping toward the central pivot at $23.14. Once cleared, the daily low of $23.07 would be up for grabs, ahead of falling to the S1 pivot point at $22.96.
Of note, oscillators like the Relative Strength Index (RSI) indicator suggest further upside expected alongside the 3-period Rate of Change (RoC).
Technical Levels: Supports and Resistances
XAGUSD currently trading at 23.57 at the time of writing. Pair opened at 23.19 and is trading with a change of 1.64 % .
| Overview | Overview.1 | |
|---|---|---|
| 0 | Today last price | 23.57 |
| 1 | Today Daily Change | 0.38 |
| 2 | Today Daily Change % | 1.64 |
| 3 | Today daily open | 23.19 |
The pair is trading below its 20 Daily moving average @ 24.18, below its 50 Daily moving average @ 24.4 , above its 100 Daily moving average @ 23.35 and above its 200 Daily moving average @ 22.06
| Trends | Trends.1 | |
|---|---|---|
| 0 | Daily SMA20 | 24.18 |
| 1 | Daily SMA50 | 24.40 |
| 2 | Daily SMA100 | 23.35 |
| 3 | Daily SMA200 | 22.06 |
The previous day high was 23.34 while the previous day low was 22.93. The daily 38.2% Fib levels comes at 23.19, expected to provide support. Similarly, the daily 61.8% fib level is at 23.09, expected to provide support.
Note the levels of interest below:
- Pivot support is noted at 22.97, 22.74, 22.55
- Pivot resistance is noted at 23.38, 23.57, 23.8
| Levels | Levels.1 |
|---|---|
| Previous Daily High | 23.34 |
| Previous Daily Low | 22.93 |
| Previous Weekly High | 23.92 |
| Previous Weekly Low | 22.68 |
| Previous Monthly High | 26.09 |
| Previous Monthly Low | 23.57 |
| Daily Fibonacci 38.2% | 23.19 |
| Daily Fibonacci 61.8% | 23.09 |
| Daily Pivot Point S1 | 22.97 |
| Daily Pivot Point S2 | 22.74 |
| Daily Pivot Point S3 | 22.55 |
| Daily Pivot Point R1 | 23.38 |
| Daily Pivot Point R2 | 23.57 |
| Daily Pivot Point R3 | 23.80 |
[/s2If]
Nehcap Expert Advisor
The NEHCAP MT4 EA is high quality professional trading system geared to generate returns without using GRID or martingales. Each trade has strict risk per trade parameter. The pairs under management include EURUSD, GBPUSD, AUDCAD, AUDNZD,GBPAUD, EURAUD, EURCAD, CHFJPY and many more.
The system is trading live: LIVE ACCOUNT TRACKING
You can run it free. Apply for a free trial and track our account. Buy the system or use profit share mechanism to generate returns on your MT4.
Join Our Telegram Group
")


