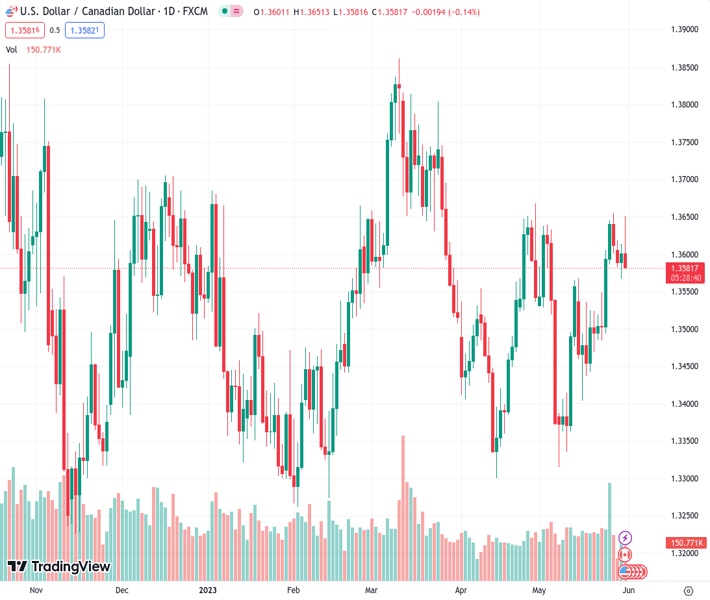
#USDCAD @ 1.35852 The pair teetered around the 1.3600 figure after the Canadian GDP Q1 results exceeded estimates, prompting anticipations of BoC policy tightening. (Pivot Orderbook analysis)
…
This is a premium post.
[s2If !current_user_can(access_s2member_level4)]Please register for FREE REGISTER to read full post below containing analysis. In case of any error or you think you are not able to read the full post below, please email us at support#nehcap.com [lwa][/s2If] [s2If current_user_can(access_s2member_level1)]
- The USD/CAD pair teetered around the 1.3600 figure after the Canadian GDP Q1 results exceeded estimates, prompting anticipations of BoC policy tightening.
- The US labor market reported an unexpected surge in job openings (JOLTs), supporting the case for additional interest rate hikes by the US Federal Reserve.
- Crude oil’s declining prices and a resilient US Dollar Index supported the greenback, offsetting the pressure from solid Canadian economic performance.
The pair currently trades last at 1.35852.
The previous day high was 1.3613 while the previous day low was 1.3567. The daily 38.2% Fib levels comes at 1.3596, expected to provide resistance. Similarly, the daily 61.8% fib level is at 1.3585, expected to provide support.
USD/CAD climbs for two straight days, though reclaiming the 1.3600 figure after solid Canadian economic data increased the odds for further tightening by the Bank of Canada (BoC). Nevertheless, recent data in the United States (US), alongside a risk-off impulse, cushioned the pair’s fall and trades at 1.3594, down by 0.06%.
Statistics Canada reported that Gross Domestic Product (GDP) for the first quarter (Q1) rose above estimates, accelerating further in April, according to data. The Canadian economy expanded by 3.1% YoY, smashing 2.5% estimates, and month-over-month (MoM) in March stood at 0%, against the above forecasts—the preliminary figure for April stood at 0.2%.
After the data was released, the USD/CAD tumbled from around 1.3640 toward 1.3606 before data from the US sponsored a short-lived recovery.
In the US, the April job openings report, known as JOLTs, unexpectedly soared to its highest level in three months, justifying the need for additional interest rate hikes by the US Federal Reserve (Fed). Vacancies grew to 10.1M, above estimates of 9.375M, and posted more than 300K compared to March. Although it cushioned the USD/CAD fall and reclaimed 1.3600, the pair extended its losses below the latter.
The greenback stood afloat as falling crude oil prices threw a lifeline, as it extended its losses by 1.32%, with the US crude oil benchmark, WTI exchanging hands at $68.53 per barrel.
Meanwhile, the US Dollar Index (DXY), which tracks the buck’s value vs. a basket of six peers, stands at 0.48%, up at 104.557, bolstered by recently released jobs data and increasing odds for another rate hike in June. The CME FedWatch Tool’s chances for an increase lie at 69.8%, above yesterday’s 66.6%.
From a technical perspective, the USD/CAD persists upward biased, despite the ongoing pullback, with sellers eyeing a test of the weekly low of 1.3567. Further deep beneath that level will immediately expose the 20-day Exponential Moving Average (EMA) at 1.3542, followed by the 50-day EMA at 1.3530. Conversely, if USD/CAD buyers reclaim 1.3600, that will exacerbate a continuation of the ongoing rally, but a decisive break above the weekly high of 1.3651 is needed to challenge 1.3700.
Technical Levels: Supports and Resistances
USDCAD currently trading at 1.3596 at the time of writing. Pair opened at 1.3602 and is trading with a change of -0.04 % .
| Overview | Overview.1 | |
|---|---|---|
| 0 | Today last price | 1.3596 |
| 1 | Today Daily Change | -0.0006 |
| 2 | Today Daily Change % | -0.0400 |
| 3 | Today daily open | 1.3602 |
The pair remains strongly bullish on the daily timeframe. It trades above its 20 SMA @ 1.3509, 50 SMA 1.3521, 100 SMA @ 1.3515 and 200 SMA @ 1.3499.
| Trends | Trends.1 | |
|---|---|---|
| 0 | Daily SMA20 | 1.3509 |
| 1 | Daily SMA50 | 1.3521 |
| 2 | Daily SMA100 | 1.3515 |
| 3 | Daily SMA200 | 1.3499 |
The previous day high was 1.3613 while the previous day low was 1.3567. The daily 38.2% Fib levels comes at 1.3596, expected to provide resistance. Similarly, the daily 61.8% fib level is at 1.3585, expected to provide support.
Note the levels of interest below:
- Pivot support is noted at 1.3575, 1.3548, 1.3529
- Pivot resistance is noted at 1.3621, 1.364, 1.3667
| Levels | Levels.1 |
|---|---|
| Previous Daily High | 1.3613 |
| Previous Daily Low | 1.3567 |
| Previous Weekly High | 1.3655 |
| Previous Weekly Low | 1.3485 |
| Previous Monthly High | 1.3668 |
| Previous Monthly Low | 1.3301 |
| Daily Fibonacci 38.2% | 1.3596 |
| Daily Fibonacci 61.8% | 1.3585 |
| Daily Pivot Point S1 | 1.3575 |
| Daily Pivot Point S2 | 1.3548 |
| Daily Pivot Point S3 | 1.3529 |
| Daily Pivot Point R1 | 1.3621 |
| Daily Pivot Point R2 | 1.3640 |
| Daily Pivot Point R3 | 1.3667 |
[/s2If]
Nehcap Expert Advisor
The NEHCAP MT4 EA is high quality professional trading system geared to generate returns without using GRID or martingales. Each trade has strict risk per trade parameter. The pairs under management include EURUSD, GBPUSD, AUDCAD, AUDNZD,GBPAUD, EURAUD, EURCAD, CHFJPY and many more.
The system is trading live: LIVE ACCOUNT TRACKING
You can run it free. Apply for a free trial and track our account. Buy the system or use profit share mechanism to generate returns on your MT4.
Join Our Telegram Group
")


