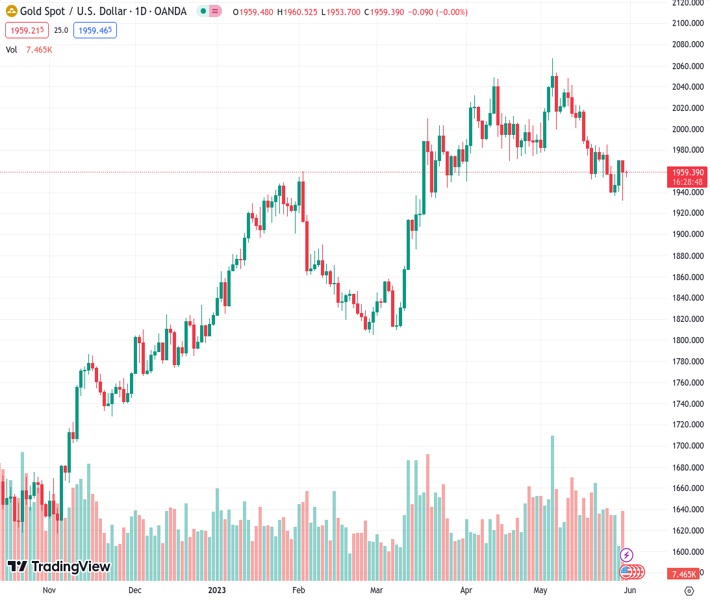
#XAUUSD @ 1,958.89 Gold price has defended its crucial support around $1,950.00, supported by weak US Treasury yields. (Pivot Orderbook analysis)
…
This is a premium post.
[s2If !current_user_can(access_s2member_level4)]Please register for FREE REGISTER to read full post below containing analysis. In case of any error or you think you are not able to read the full post below, please email us at support#nehcap.com [lwa][/s2If] [s2If current_user_can(access_s2member_level1)]
- Gold price has defended its crucial support around $1,950.00, supported by weak US Treasury yields.
- The USD Index has delivered a V-shape recovery after defending the crucial support of 104.00 amid hawkish Fed bets.
- Gold price has turned sideways around $1,960.00 after delivering a breakout of the Falling Wedge pattern.
The pair currently trades last at 1958.89.
The previous day high was 1963.56 while the previous day low was 1932.12. The daily 38.2% Fib levels comes at 1951.55, expected to provide support. Similarly, the daily 61.8% fib level is at 1944.13, expected to provide support.
Gold price (XAU/USD) has shown some recovery after defending its close support of $1,950.00 in the Tokyo session. Broadly, the precious metal is consolidating in a range of $1,953-1,960 as investors are awaiting the release of the United States Employment data.
S&P500 futures have added more losses in Asia, portraying a decline in the risk appetite of the market participants. The US Dollar Index (DXY) has delivered a V-shape recovery after defending the crucial support of 104.00.
Investors should note that Gold price has managed to defend the downside despite extreme strength in the US Dollar bulls. The Gold price is being supported by falling US Treasury yields. Growing optimism about a clear passage for the novel US debt-ceiling proposal in Congress has weighed heavily on the US Treasury yields. The yields offered on 10-year US government bonds have dropped 3.68%.
A conservative approach should be taken as the Gold price could face pressure considering the strength of the US Dollar and deepening expectations of one more interest rate hike by the Federal Reserve (Fed).
Going forward, US JOTLS Job Openings data and the release of Fed’s Beige Book will be keenly watched. According to the estimates, total job openings have dropped to 9.375M vs. the former release of 9.59M.
Gold price has turned sideways around $1,960.00 after delivering a breakout of the Falling Wedge chart pattern formed on a two-hour scale. A breakout of the aforementioned pattern indicates a bullish reversal. The 20-period Exponential Moving Average (EMA) at $1,953.36 is providing a cushion to the Gold bulls.
The Relative Strength Index (RSI) (14) is making efforts for shifting into the bullish range of 60.00-80.00. An occurrence of the same will be followed by activation of the bullish momentum.
Technical Levels: Supports and Resistances
XAUUSD currently trading at 1959.18 at the time of writing. Pair opened at 1959.28 and is trading with a change of -0.01 % .
| Overview | Overview.1 | |
|---|---|---|
| 0 | Today last price | 1959.18 |
| 1 | Today Daily Change | -0.10 |
| 2 | Today Daily Change % | -0.01 |
| 3 | Today daily open | 1959.28 |
The pair is trading below its 20 Daily moving average @ 1991.79, below its 50 Daily moving average @ 1991.7 , above its 100 Daily moving average @ 1936.74 and above its 200 Daily moving average @ 1832.52
| Trends | Trends.1 | |
|---|---|---|
| 0 | Daily SMA20 | 1991.79 |
| 1 | Daily SMA50 | 1991.70 |
| 2 | Daily SMA100 | 1936.74 |
| 3 | Daily SMA200 | 1832.52 |
The previous day high was 1963.56 while the previous day low was 1932.12. The daily 38.2% Fib levels comes at 1951.55, expected to provide support. Similarly, the daily 61.8% fib level is at 1944.13, expected to provide support.
Note the levels of interest below:
- Pivot support is noted at 1939.75, 1920.21, 1908.31
- Pivot resistance is noted at 1971.19, 1983.09, 2002.63
| Levels | Levels.1 |
|---|---|
| Previous Daily High | 1963.56 |
| Previous Daily Low | 1932.12 |
| Previous Weekly High | 1985.30 |
| Previous Weekly Low | 1936.77 |
| Previous Monthly High | 2048.75 |
| Previous Monthly Low | 1949.83 |
| Daily Fibonacci 38.2% | 1951.55 |
| Daily Fibonacci 61.8% | 1944.13 |
| Daily Pivot Point S1 | 1939.75 |
| Daily Pivot Point S2 | 1920.21 |
| Daily Pivot Point S3 | 1908.31 |
| Daily Pivot Point R1 | 1971.19 |
| Daily Pivot Point R2 | 1983.09 |
| Daily Pivot Point R3 | 2002.63 |
[/s2If]
Nehcap Expert Advisor
The NEHCAP MT4 EA is high quality professional trading system geared to generate returns without using GRID or martingales. Each trade has strict risk per trade parameter. The pairs under management include EURUSD, GBPUSD, AUDCAD, AUDNZD,GBPAUD, EURAUD, EURCAD, CHFJPY and many more.
The system is trading live: LIVE ACCOUNT TRACKING
You can run it free. Apply for a free trial and track our account. Buy the system or use profit share mechanism to generate returns on your MT4.
Join Our Telegram Group


