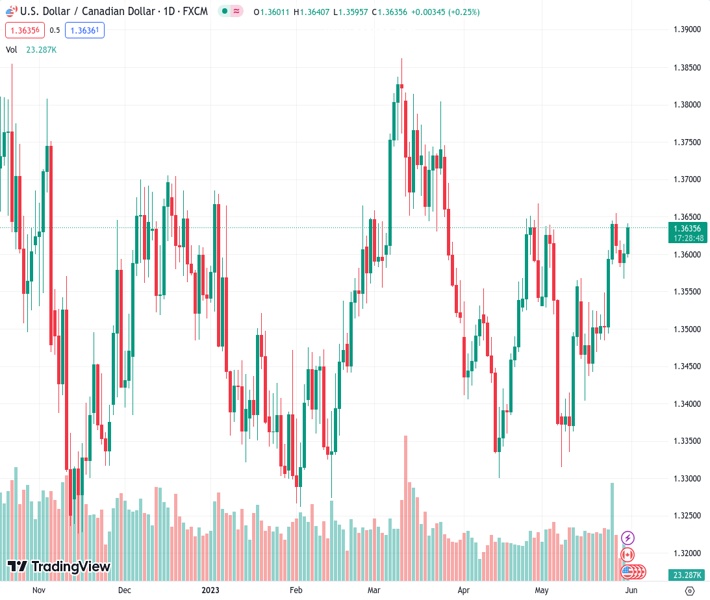
#USDCAD @ 1.36356 grinds near intraday high, extends previous day’s rebound from one-week low., @nehcap view: Further upside expected (Pivot Orderbook analysis)
…
This is a premium post.
[s2If !current_user_can(access_s2member_level4)]Please register for FREE REGISTER to read full post below containing analysis. In case of any error or you think you are not able to read the full post below, please email us at support#nehcap.com [lwa][/s2If] [s2If current_user_can(access_s2member_level1)]
- USD/CAD grinds near intraday high, extends previous day’s rebound from one-week low.
- Downward-sloping resistance line from late March restricts immediate upside of Loonie pair.
- Looming bull cross on MACD, firmer RSI (14) line favors USD/CAD buyers.
- Canada Q1 GDP, risk catalysts eyed for clear directions.
The pair currently trades last at 1.36356.
The previous day high was 1.3613 while the previous day low was 1.3567. The daily 38.2% Fib levels comes at 1.3596, expected to provide support. Similarly, the daily 61.8% fib level is at 1.3585, expected to provide support.
USD/CAD picks up bids to attack a two-month-old descending resistance line around 1.3650 heading into Wednesday’s European session. In doing so, the Loonie pair justifies the market’s cautious mood ahead of the Canadian first quarter (Q1) 2023 Gross Domestic Product (GDP), as well as the key risk catalysts, namely the US debt ceiling deal updates and the Fed bets.
Also read: USD/CAD struggles to cheer Oil price slump near 1.3600 as US Dollar retreats ahead of top-tier catalysts
That said, the Loonie pair currently prods a downward-sloping resistance line from March 28, close to 1.3640 at the latest.
Even so, the recently firmer RSI (14) line, not overbought, joins the looming bull cross on the MACD indicator to keep the USD/CAD buyers hopeful of crossing the immediate 1.3640 resistance line.
Following that, April’s high near 1.3665-70 may act as an extra filter towards the north before directing the USD/CAD toward the late March swing high of around 1.3700 round figure.
On the flip side, a three-week-long ascending trend line and the 50-SMA, respectively near 1.3575 and 1.3565, could challenge the USD/CAD bears.
However, the Loonie pair’s bearish trajectory past 1.3565 needs validation from the previous resistance line from March 10, close to 1.3530.
Overall, USD/CAD is likely to remain firmer and can overcome the immediate upside hurdle.
Trend: Further upside expected
Technical Levels: Supports and Resistances
USDCAD currently trading at 1.3638 at the time of writing. Pair opened at 1.3602 and is trading with a change of 0.26% % .
| Overview | Overview.1 | |
|---|---|---|
| 0 | Today last price | 1.3638 |
| 1 | Today Daily Change | 0.0036 |
| 2 | Today Daily Change % | 0.26% |
| 3 | Today daily open | 1.3602 |
The pair remains strongly bullish on the daily timeframe. It trades above its 20 SMA @ 1.3509, 50 SMA 1.3521, 100 SMA @ 1.3515 and 200 SMA @ 1.3499.
| Trends | Trends.1 | |
|---|---|---|
| 0 | Daily SMA20 | 1.3509 |
| 1 | Daily SMA50 | 1.3521 |
| 2 | Daily SMA100 | 1.3515 |
| 3 | Daily SMA200 | 1.3499 |
The previous day high was 1.3613 while the previous day low was 1.3567. The daily 38.2% Fib levels comes at 1.3596, expected to provide support. Similarly, the daily 61.8% fib level is at 1.3585, expected to provide support.
Note the levels of interest below:
- Pivot support is noted at 1.3575, 1.3548, 1.3529
- Pivot resistance is noted at 1.3621, 1.364, 1.3667
| Levels | Levels.1 |
|---|---|
| Previous Daily High | 1.3613 |
| Previous Daily Low | 1.3567 |
| Previous Weekly High | 1.3655 |
| Previous Weekly Low | 1.3485 |
| Previous Monthly High | 1.3668 |
| Previous Monthly Low | 1.3301 |
| Daily Fibonacci 38.2% | 1.3596 |
| Daily Fibonacci 61.8% | 1.3585 |
| Daily Pivot Point S1 | 1.3575 |
| Daily Pivot Point S2 | 1.3548 |
| Daily Pivot Point S3 | 1.3529 |
| Daily Pivot Point R1 | 1.3621 |
| Daily Pivot Point R2 | 1.3640 |
| Daily Pivot Point R3 | 1.3667 |
[/s2If]
Nehcap Expert Advisor
The NEHCAP MT4 EA is high quality professional trading system geared to generate returns without using GRID or martingales. Each trade has strict risk per trade parameter. The pairs under management include EURUSD, GBPUSD, AUDCAD, AUDNZD,GBPAUD, EURAUD, EURCAD, CHFJPY and many more.
The system is trading live: LIVE ACCOUNT TRACKING
You can run it free. Apply for a free trial and track our account. Buy the system or use profit share mechanism to generate returns on your MT4.
Join Our Telegram Group


