#USDMXN @ 17.6877 picks up bids to extend previous recovery from fortnight low., @nehcap view: Limited upside expected (Pivot Orderbook analysis)
…
This is a premium post.
[s2If !current_user_can(access_s2member_level4)]Please register for FREE REGISTER to read full post below containing analysis. In case of any error or you think you are not able to read the full post below, please email us at support#nehcap.com [lwa][/s2If] [s2If current_user_can(access_s2member_level1)]
- USD/MXN picks up bids to extend previous recovery from fortnight low.
- Convergence of 100-HMA, one-week-old descending trend line prod pair buyers.
- 200-HMA acts as additional hurdle for Mexican Peso sellers.
- Two-week-old horizontal support is the key for pair bears to conquer.
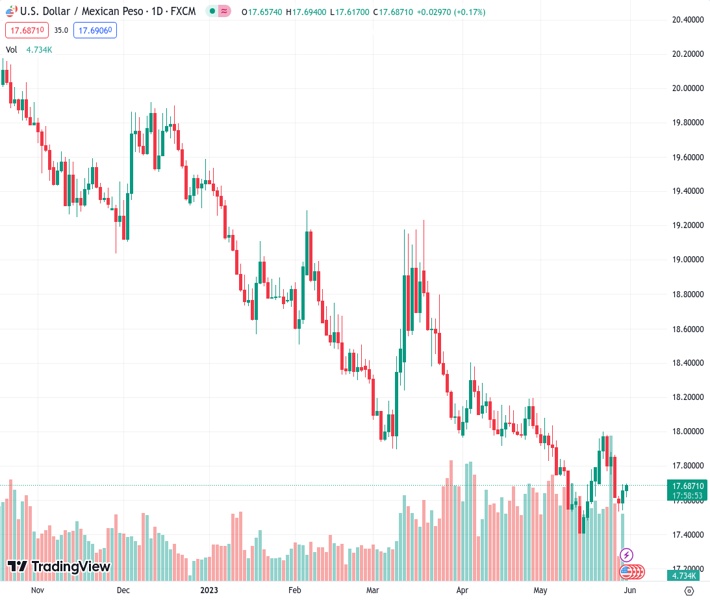
The pair currently trades last at 17.6877.
The previous day high was 17.6936 while the previous day low was 17.5411. The daily 38.2% Fib levels comes at 17.6354, expected to provide support. Similarly, the daily 61.8% fib level is at 17.5994, expected to provide support.
USD/MXN holds onto the previous day’s recovery from a two-week low as bulls poke a 17.69 resistance confluence during early Wednesday.
In doing so, the Mexican Peso (MXN) pair struggles to extend recovery from a fortnight-long horizontal support while jostling with the short-term key upside hurdle comprising the 100-Hour Moving Average (HMA) and a one-week-old descending trend line.
It’s worth noting that the overbought RSI (14) conditions challenge the USD/MXN buyers around the 17.69 resistance confluence.
Even if the quote crosses the 17.69 key resistance, the 17.70 round figure and the 200-HMA level of 17.76 may act as extra filters toward the north ahead of directing the pair buyers toward the monthly peak of near the 18.00 round figure.
Alternatively, the USD/MXN pair’s pullback remains elusive unless the quote stays beyond the 61.8% Fibonacci retracement level of May 15-23 upside, near 17.64 at the latest.
Should the quote drops below 17.64, it can drop to the aforementioned two-week-old horizontal support zone surrounding 17.54-53.
The USD/MXN pair’s south-run towards the multi-month low marked earlier in May around 17.42 and the year 2016 low of near 17.05 can’t be ruled out.
Trend: Limited upside expected
Technical Levels: Supports and Resistances
USDMXN currently trading at 17.6923 at the time of writing. Pair opened at 17.6569 and is trading with a change of 0.20% % .
| Overview | Overview.1 | |
|---|---|---|
| 0 | Today last price | 17.6923 |
| 1 | Today Daily Change | 0.0354 |
| 2 | Today Daily Change % | 0.20% |
| 3 | Today daily open | 17.6569 |
The pair remains strongly bearish on the daily time frame. It trades below the 20 SMA @ 17.7172, 50 SMA 17.9675, 100 SMA @ 18.2927 and 200 SMA @ 19.0207.
| Trends | Trends.1 | |
|---|---|---|
| 0 | Daily SMA20 | 17.7172 |
| 1 | Daily SMA50 | 17.9675 |
| 2 | Daily SMA100 | 18.2927 |
| 3 | Daily SMA200 | 19.0207 |
The previous day high was 17.6936 while the previous day low was 17.5411. The daily 38.2% Fib levels comes at 17.6354, expected to provide support. Similarly, the daily 61.8% fib level is at 17.5994, expected to provide support.
Note the levels of interest below:
- Pivot support is noted at 17.5675, 17.478, 17.415
- Pivot resistance is noted at 17.72, 17.7831, 17.8725
| Levels | Levels.1 |
|---|---|
| Previous Daily High | 17.6936 |
| Previous Daily Low | 17.5411 |
| Previous Weekly High | 17.9981 |
| Previous Weekly Low | 17.6165 |
| Previous Monthly High | 18.4018 |
| Previous Monthly Low | 17.9329 |
| Daily Fibonacci 38.2% | 17.6354 |
| Daily Fibonacci 61.8% | 17.5994 |
| Daily Pivot Point S1 | 17.5675 |
| Daily Pivot Point S2 | 17.4780 |
| Daily Pivot Point S3 | 17.4150 |
| Daily Pivot Point R1 | 17.7200 |
| Daily Pivot Point R2 | 17.7831 |
| Daily Pivot Point R3 | 17.8725 |
[/s2If]
Nehcap Expert Advisor
The NEHCAP MT4 EA is high quality professional trading system geared to generate returns without using GRID or martingales. Each trade has strict risk per trade parameter. The pairs under management include EURUSD, GBPUSD, AUDCAD, AUDNZD,GBPAUD, EURAUD, EURCAD, CHFJPY and many more.
The system is trading live: LIVE ACCOUNT TRACKING
You can run it free. Apply for a free trial and track our account. Buy the system or use profit share mechanism to generate returns on your MT4.
Join Our Telegram Group


