#AUDUSD @ 0.65053 portrays a volatile reaction to Australia inflation data, China activity numbers. (Pivot Orderbook analysis)
…
This is a premium post.
[s2If !current_user_can(access_s2member_level4)]Please register for FREE REGISTER to read full post below containing analysis. In case of any error or you think you are not able to read the full post below, please email us at support#nehcap.com [lwa][/s2If] [s2If current_user_can(access_s2member_level1)]
- AUD/USD portrays a volatile reaction to Australia inflation data, China activity numbers.
- Australia Monthly Consumer Price Index jumps to 6.8% in April, China’s officials PMIs ease for May.
- Market sentiment dwindles amid mixed signals from data, risk catalysts.
- US House of Representatives’ voting on measures to avoid default, JOLTS Job Openings eyed for clear directions.
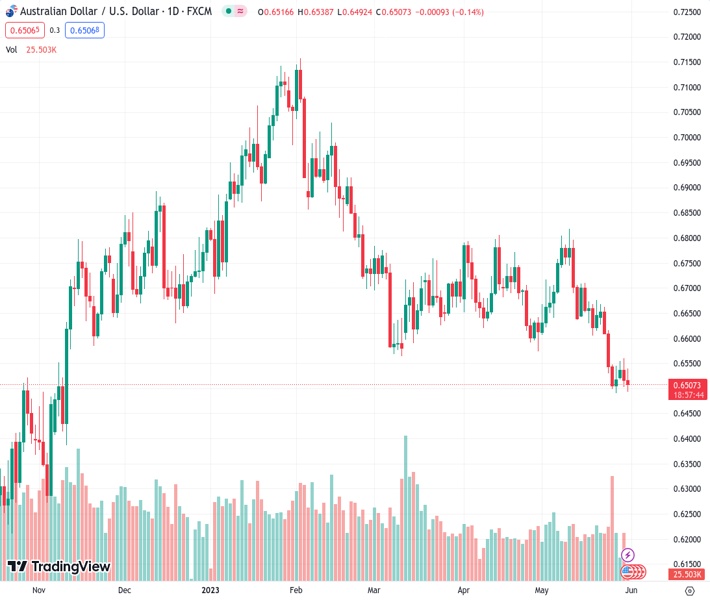
The pair currently trades last at 0.65053.
The previous day high was 0.6559 while the previous day low was 0.6503. The daily 38.2% Fib levels comes at 0.6524, expected to provide resistance. Similarly, the daily 61.8% fib level is at 0.6538, expected to provide resistance.
AUD/USD fails to cheer upbeat Australian inflation data for long as it refreshed its intraday high to 0.6540 before plummeting to 0.6498 on downbeat China activity data. Apart from the data, fears of US default and hawkish Fed bets also exert downside pressure on the Aussie pair.
Australia’s Monthly Consumer Price Index (CPI) for April rises 6.8% YoY versus 6.3% prior. Further, China’s official activity numbers for May came in mixed.
That said, China NBS Manufacturing PMI eases to 48.8 from 49.4 expected and 49.2 prior whereas Non-Manufacturing PMI rose past 50.7 market forecasts to 54.5 and 56.4 previous readings.
Earlier in the day, Reserve Bank of Australia (RBA) Governor Philip Lowe spread hawkish remarks while saying that “(He) will do what is necessary to make sure inflation comes back to target range in next few years.” It’s worth noting that the policymaker also said, “We’re in data-dependent mode.”
Hence, the latest data fails to justify the hawkish remarks from RBA’s Lowe and hence exerts downside pressure on the AUD/USD pair.
Apart from the data, sluggish sentiment also weighs on the Aussie pair as the S&P500 Futures remain indecisive after a mixed Wall Street close while the US Treasury bond yields stay depressed of late. Furthermore, the US Dollar Index (DXY) inaction around 104.00, after snapping a six-day uptrend near the highest levels in 10 weeks, also please the AUD/USD pair sellers.
Having witnessed the initial reaction to a slew of data, the AUD/USD pair may witness a lackluster day ahead as markets may turn cautious ahead of the key US event, namely the House voting on the US debt ceiling deal. Also important to watch is the US JOLTS Job Openings for April, expected 9.375M versus 9.59M prior, as well as the Chicago Purchasing Managers’ Index for May, likely to fall to 47.0 from 48.6.
Should the US Republicans bloc the debt limit extension, the market may witness a shock and the same can propel riskier assets, which in turn keeps the AUD/USD bears hopeful due to its risk barometer status. However, the US Dollar may not be able to cheer the same and hence can prod the bears provided the US data disappoints with a huge margin.
AUD/USD remains bearish unless crossing the previous support line from March, around 0.6560 by the press time. That said, a three-week-old falling trend line, close to 0.6540 at the latest, guards the immediate recovery of the Aussie pair.
It’s worth noting that the downbeat RSI prods sellers even as MACD signals and the pair’s sustained trading below the previous key support hint at the quote’s further downside.
Technical Levels: Supports and Resistances
AUDUSD currently trading at 0.6517 at the time of writing. Pair opened at 0.6517 and is trading with a change of -0.00% % .
| Overview | Overview.1 | |
|---|---|---|
| 0 | Today last price | 0.6517 |
| 1 | Today Daily Change | 0.0000 |
| 2 | Today Daily Change % | -0.00% |
| 3 | Today daily open | 0.6517 |
The pair remains strongly bearish on the daily time frame. It trades below the 20 SMA @ 0.6648, 50 SMA 0.667, 100 SMA @ 0.6766 and 200 SMA @ 0.67.
| Trends | Trends.1 | |
|---|---|---|
| 0 | Daily SMA20 | 0.6648 |
| 1 | Daily SMA50 | 0.6670 |
| 2 | Daily SMA100 | 0.6766 |
| 3 | Daily SMA200 | 0.6700 |
The previous day high was 0.6559 while the previous day low was 0.6503. The daily 38.2% Fib levels comes at 0.6524, expected to provide resistance. Similarly, the daily 61.8% fib level is at 0.6538, expected to provide resistance.
Note the levels of interest below:
- Pivot support is noted at 0.6494, 0.647, 0.6437
- Pivot resistance is noted at 0.655, 0.6583, 0.6607
| Levels | Levels.1 |
|---|---|
| Previous Daily High | 0.6559 |
| Previous Daily Low | 0.6503 |
| Previous Weekly High | 0.6668 |
| Previous Weekly Low | 0.6490 |
| Previous Monthly High | 0.6806 |
| Previous Monthly Low | 0.6574 |
| Daily Fibonacci 38.2% | 0.6524 |
| Daily Fibonacci 61.8% | 0.6538 |
| Daily Pivot Point S1 | 0.6494 |
| Daily Pivot Point S2 | 0.6470 |
| Daily Pivot Point S3 | 0.6437 |
| Daily Pivot Point R1 | 0.6550 |
| Daily Pivot Point R2 | 0.6583 |
| Daily Pivot Point R3 | 0.6607 |
[/s2If]
Nehcap Expert Advisor
The NEHCAP MT4 EA is high quality professional trading system geared to generate returns without using GRID or martingales. Each trade has strict risk per trade parameter. The pairs under management include EURUSD, GBPUSD, AUDCAD, AUDNZD,GBPAUD, EURAUD, EURCAD, CHFJPY and many more.
The system is trading live: LIVE ACCOUNT TRACKING
You can run it free. Apply for a free trial and track our account. Buy the system or use profit share mechanism to generate returns on your MT4.
Join Our Telegram Group


