#EURUSD @ 1.07300 struggles to extend corrective bounce off multi-day low., @nehcap view: Further recovery expected (Pivot Orderbook analysis)
…
This is a premium post.
[s2If !current_user_can(access_s2member_level4)]Please register for FREE REGISTER to read full post below containing analysis. In case of any error or you think you are not able to read the full post below, please email us at support#nehcap.com [lwa][/s2If] [s2If current_user_can(access_s2member_level1)]
- EUR/USD struggles to extend corrective bounce off multi-day low.
- Bearish MACD signals, market’s cautious mood prod Euro buyers.
- RSI conditions, clear break of previous key resistances keep buyers directed towards 100-DMA.
- Sellers need validation from five-month-old ascending support line to retake control.
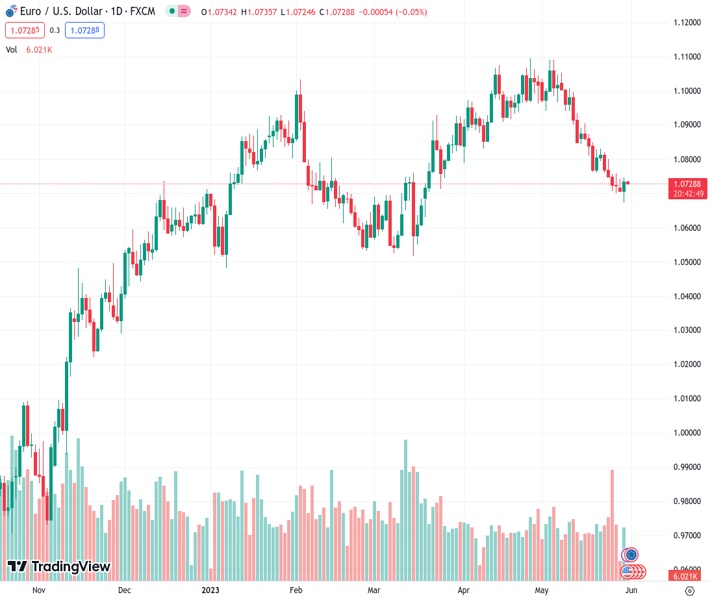
The pair currently trades last at 1.07300.
The previous day high was 1.0747 while the previous day low was 1.0672. The daily 38.2% Fib levels comes at 1.072, expected to provide support. Similarly, the daily 61.8% fib level is at 1.0729, expected to provide support.
EUR/USD remains sidelined around 1.0730-35 as bulls seek more clues to extend the previous day’s recovery from a 10-week low amid Wednesday’s sluggish Asian session. In doing so, the Euro pair portrays the market’s anxiety as the key European/US data and events stand ready to prod the market’s momentum.
Also read: EUR/USD rebound pauses around 1.0750, German inflation, US employment clues eyed
That said, the Euro pair’s successful trading above a downward-sloping trend line from early May, around 1.0725, as well as the 61.8% Fibonacci retracement of its January-May upside, near 1.0715, joins the nearly oversold RSI (14) line to keep the buyers hopeful of further upside.
However, the bearish MACD signals and a horizontal area comprising multiple levels marked since mid-March, close to 1.0760, appear a tough nut to crack for the EUR/USD bulls.
Even if the Euro buyers manage to cross the 1.0760 hurdle, the 100-DMA level surrounding 1.0815 can act as the last defense of the bears.
Meanwhile, the EUR/USD pair’s downside remains elusive unless it drops back below the aforementioned 61.8% Fibonacci retracement level, also known as the golden ratio, around 1.0715. It should be noted that the resistance-turned-support line near 1.0725 limits the immediate downside of the quote.
In a case where the EUR/USD drops below 1.0715, the 1.0700 round figure and an upward-sloping support line from March 15 will be in the spotlight.
Trend: Further recovery expected
Technical Levels: Supports and Resistances
EURUSD currently trading at 1.0732 at the time of writing. Pair opened at 1.0734 and is trading with a change of -0.02% % .
| Overview | Overview.1 | |
|---|---|---|
| 0 | Today last price | 1.0732 |
| 1 | Today Daily Change | -0.0002 |
| 2 | Today Daily Change % | -0.02% |
| 3 | Today daily open | 1.0734 |
The pair is trading below its 20 Daily moving average @ 1.0859, below its 50 Daily moving average @ 1.0903 , below its 100 Daily moving average @ 1.0816 and above its 200 Daily moving average @ 1.049
| Trends | Trends.1 | |
|---|---|---|
| 0 | Daily SMA20 | 1.0859 |
| 1 | Daily SMA50 | 1.0903 |
| 2 | Daily SMA100 | 1.0816 |
| 3 | Daily SMA200 | 1.0490 |
The previous day high was 1.0747 while the previous day low was 1.0672. The daily 38.2% Fib levels comes at 1.072, expected to provide support. Similarly, the daily 61.8% fib level is at 1.0729, expected to provide support.
Note the levels of interest below:
- Pivot support is noted at 1.0689, 1.0644, 1.0615
- Pivot resistance is noted at 1.0763, 1.0792, 1.0837
| Levels | Levels.1 |
|---|---|
| Previous Daily High | 1.0747 |
| Previous Daily Low | 1.0672 |
| Previous Weekly High | 1.0831 |
| Previous Weekly Low | 1.0702 |
| Previous Monthly High | 1.1095 |
| Previous Monthly Low | 1.0788 |
| Daily Fibonacci 38.2% | 1.0720 |
| Daily Fibonacci 61.8% | 1.0729 |
| Daily Pivot Point S1 | 1.0689 |
| Daily Pivot Point S2 | 1.0644 |
| Daily Pivot Point S3 | 1.0615 |
| Daily Pivot Point R1 | 1.0763 |
| Daily Pivot Point R2 | 1.0792 |
| Daily Pivot Point R3 | 1.0837 |
[/s2If]
Nehcap Expert Advisor
The NEHCAP MT4 EA is high quality professional trading system geared to generate returns without using GRID or martingales. Each trade has strict risk per trade parameter. The pairs under management include EURUSD, GBPUSD, AUDCAD, AUDNZD,GBPAUD, EURAUD, EURCAD, CHFJPY and many more.
The system is trading live: LIVE ACCOUNT TRACKING
You can run it free. Apply for a free trial and track our account. Buy the system or use profit share mechanism to generate returns on your MT4.
Join Our Telegram Group


