WTI falls for the second consecutive day on concerns about the passage of the US debt-ceiling bill and conflicting statements from oil producers. (Pivot Orderbook analysis)
…
This is a premium post.
[s2If !current_user_can(access_s2member_level4)]Please register for FREE REGISTER to read full post below containing analysis. In case of any error or you think you are not able to read the full post below, please email us at support#nehcap.com [lwa][/s2If] [s2If current_user_can(access_s2member_level1)]
- WTI falls for the second consecutive day on concerns about the passage of the US debt-ceiling bill and conflicting statements from oil producers.
- Some Republicans express reluctance to pass the debt-ceiling pact, raising fears about the US government’s ability to meet its financial obligations.
- OPEC+ meeting on June 4 fuels market unease as speculations arise about potential oil production cuts.
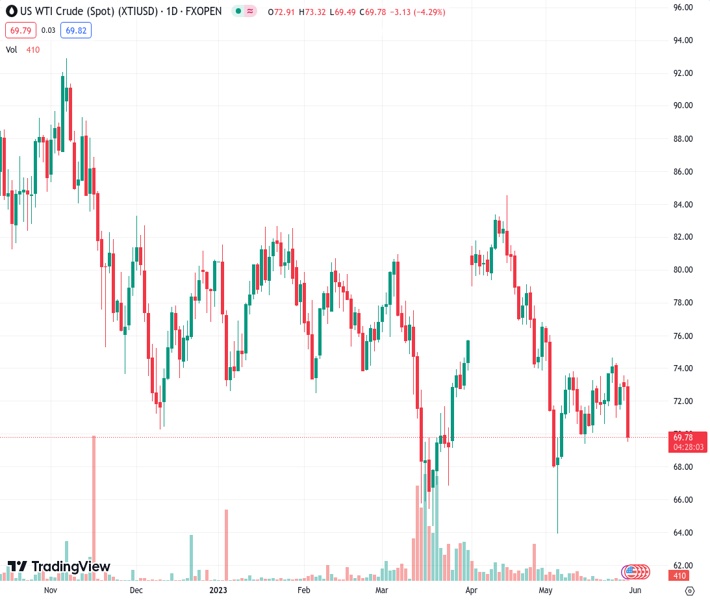
The pair currently trades last at 69.79.
The previous day high was 73.58 while the previous day low was 72.06. The daily 38.2% Fib levels comes at 73.0, expected to provide resistance. Similarly, the daily 61.8% fib level is at 72.64, expected to provide resistance.
Western Texas Intermediate (WTI), the US crude oil benchmark plummets for the second straight day by more than 4%, spurred by woes about whether the US Congress will pass the US debt-ceiling bill as some Republicans had expressed that they would not pass the pact. That, alongside mixed messages by crude oil producers, exerts downward pressure on WTI. WTI is trading at $69.58 after hitting a daily high of $73.33.
News emerged during the weekend that US President Joe Biden and US House Speaker Kevin McCarthy sealed an agreement to suspend the debt ceiling until January 1, 2025, but it{s pending approval by the US Congress. US Treasury Secretary Janet Yellen said that the US government could not pay its debt by June 5.
Aside from this, the Organization of Petroleum Export Countries and its allies (OPEC+) would meet on June 4, one day before the US debt-ceiling deadline. Investors are nervous about the outcome of oil production, as the Saudi Arabian Energy Minister Abdulaziz bin Salman warned short sellers, which are betting that prices will fall.
That increased speculations that crude oil output could be cut, while Russian Deputy Prime Minister Alexander Novak signaled that the world’s third largest producer would keep production unchanged.
On April 6, Saudi Arabia and other OPEC+ members announced 1.2 million barrels cut per day, triggering a jump of 6% in oil prices. Nevertheless, prices stabilized and erased those gains.
WTI traders should be aware of the release of China’s business activity report late this week, alongside Global PMIs, which could give us clues about the pace of growth of the global economy.
Technical Levels: Supports and Resistances
XTIUSD currently trading at 69.79 at the time of writing. Pair opened at 72.96 and is trading with a change of -4.34 % .
| Overview | Overview.1 | |
|---|---|---|
| 0 | Today last price | 69.79 |
| 1 | Today Daily Change | -3.17 |
| 2 | Today Daily Change % | -4.34 |
| 3 | Today daily open | 72.96 |
The pair remains strongly bearish on the daily time frame. It trades below the 20 SMA @ 71.81, 50 SMA 74.73, 100 SMA @ 75.99 and 200 SMA @ 79.54.
| Trends | Trends.1 | |
|---|---|---|
| 0 | Daily SMA20 | 71.81 |
| 1 | Daily SMA50 | 74.73 |
| 2 | Daily SMA100 | 75.99 |
| 3 | Daily SMA200 | 79.54 |
The previous day high was 73.58 while the previous day low was 72.06. The daily 38.2% Fib levels comes at 73.0, expected to provide resistance. Similarly, the daily 61.8% fib level is at 72.64, expected to provide resistance.
Note the levels of interest below:
- Pivot support is noted at 72.15, 71.35, 70.63
- Pivot resistance is noted at 73.67, 74.38, 75.19
| Levels | Levels.1 |
|---|---|
| Previous Daily High | 73.58 |
| Previous Daily Low | 72.06 |
| Previous Weekly High | 74.70 |
| Previous Weekly Low | 70.66 |
| Previous Monthly High | 83.40 |
| Previous Monthly Low | 73.88 |
| Daily Fibonacci 38.2% | 73.00 |
| Daily Fibonacci 61.8% | 72.64 |
| Daily Pivot Point S1 | 72.15 |
| Daily Pivot Point S2 | 71.35 |
| Daily Pivot Point S3 | 70.63 |
| Daily Pivot Point R1 | 73.67 |
| Daily Pivot Point R2 | 74.38 |
| Daily Pivot Point R3 | 75.19 |
[/s2If]
Nehcap Expert Advisor
The NEHCAP MT4 EA is high quality professional trading system geared to generate returns without using GRID or martingales. Each trade has strict risk per trade parameter. The pairs under management include EURUSD, GBPUSD, AUDCAD, AUDNZD,GBPAUD, EURAUD, EURCAD, CHFJPY and many more.
The system is trading live: LIVE ACCOUNT TRACKING
You can run it free. Apply for a free trial and track our account. Buy the system or use profit share mechanism to generate returns on your MT4.
Join Our Telegram Group


