Oil price weakens on fears debt-ceiling deal could be derailed
…
This is a premium post.
[s2If !current_user_can(access_s2member_level4)]Please register for FREE REGISTER to read full post below containing analysis. In case of any error or you think you are not able to read the full post below, please email us at support#nehcap.com [lwa][/s2If] [s2If current_user_can(access_s2member_level1)]
Oil price slides lower on Tuesday as investors question whether the debt-ceiling deal will get voted into law. At least two rebel Republicans and one Democrat have voiced their disapproval and may vote against the deal. If the US defaults on its obligations, financial chaos is expected to follow, probably hitting the Oil price, though some analysts have said the US Dollar might also suffer, which would be positive for Oil since it is mostly priced in USD. Mixed messaging from OPEC+ adds to the opaque outlook.
At the time of writing, WTI Oil is trading in the upper $71s and Brent Crude Oil in the upper $75s.
Oil news and market movers
Crude Oil Technical Analysis: Mixed technical outlook leads to waiting game
WTI Oil is in an established downtrend from a technical perspective, making successive lower lows, and so given the old adage that the trend is your friend, this overall favors short sellers over longs. WTI Oil is trading below all the major daily Simple Moving Averages (SMA) and all the weekly SMAs except the 200-week, which is at $66.90.
WTI US Oil: Weekly Chart
That said, a possible bullish right-angled triangle may have just finished forming, as shown by the dotted lines on the chart below.
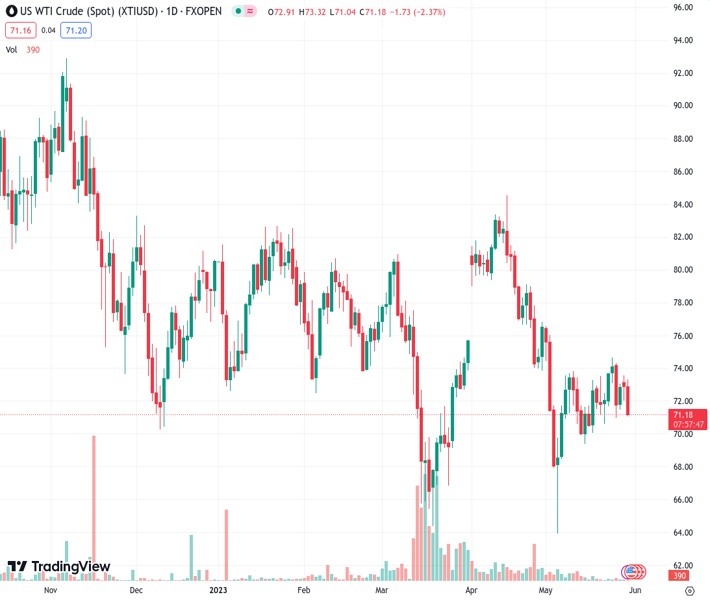
WTI US Oil: Daily Chart
Price initially seemed to break out above the upper borderline of the triangle on May 24 but then failed to follow through higher and reversed, forming a spinning top Japanese candlestick reversal pattern in the process. It then rallied on Monday before capitulating again and is currently trading back below the lower border.
A decisive break below the May 22 lows of $70.65, or better still, the $69.40 May 15 lows, would provide confirmation that the triangle is actually breaking out lower. Such a break ought to be represented by a long red candlestick or three down-days in a row for solid confirmation.
A break below the year-to-date (YTD) lows of $64.31 would imply a new lower low was forming, reigniting the downtrend. The next target from there would be at around $62.00, where trough lows from 2021 will come into play, followed by support at $57.50.
A breakout higher is still possible, however. The three green up bars in a row that occurred prior to the bullish breakout on May 24 are a strong signal, suggesting there is still a chance price could recover.
Oil price needs to climb back above the $74.70 May 24 highs for confirmation.
Such a bullish breakout could see Oil price rise in a volatile rally to a potential target in the $79.70s, calculated by using the usual technical method, which is to take 61.8% of the height of the triangle and extrapolate it from the breakout point higher. Oil price could even go as far as a 100% extrapolation, however, the 61.8% level roughly coincides with the 200-day SMA and the main trendline for the bear market, heightening its importance as a key resistance level.
Assuming Oil price reaches its target, a bullish break would also signify that price had surpassed the key $76.85 lower high of April 28, thereby, bringing the dominant bear trend into doubt.
The long hammer Japanese candlestick pattern that formed at the May 4 (and year-to-date) lows is a further sign that Oil price may have formed a strategic bottom.
Further, the mild bullish convergence between price and the Relative Strength Index (RSI) at the March and May 2023 lows – with price making a lower low in May that is not matched by a lower low in RSI – is a sign that bearish pressure is easing.
[/s2If]
Nehcap Expert Advisor
The NEHCAP MT4 EA is high quality professional trading system geared to generate returns without using GRID or martingales. Each trade has strict risk per trade parameter. The pairs under management include EURUSD, GBPUSD, AUDCAD, AUDNZD,GBPAUD, EURAUD, EURCAD, CHFJPY and many more.
The system is trading live: LIVE ACCOUNT TRACKING
You can run it free. Apply for a free trial and track our account. Buy the system or use profit share mechanism to generate returns on your MT4.
Join Our Telegram Group


