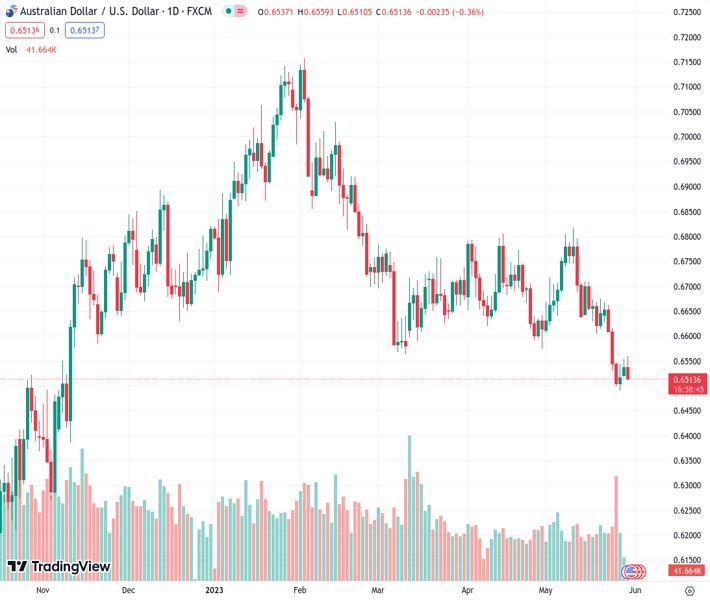
#AUDUSD @ 0.65147 takes offers to refresh intraday low inside bearish chart formation., @nehcap view: Further downside expected (Pivot Orderbook analysis)
…
This is a premium post.
[s2If !current_user_can(access_s2member_level4)]Please register for FREE REGISTER to read full post below containing analysis. In case of any error or you think you are not able to read the full post below, please email us at support#nehcap.com [lwa][/s2If] [s2If current_user_can(access_s2member_level1)]
- AUD/USD takes offers to refresh intraday low inside bearish chart formation.
- Absence of oversold RSI (14) line adds strength to downside bias.
- Aussie pair’s recovery remains elusive unless breaking one-week-old falling resistance line.
The pair currently trades last at 0.65147.
The previous day high was 0.6554 while the previous day low was 0.6514. The daily 38.2% Fib levels comes at 0.6539, expected to provide resistance. Similarly, the daily 61.8% fib level is at 0.653, expected to provide resistance.
AUD/USD renews its intraday bottom around 0.6530 as it prints the first daily loss in three amid early Tuesday morning in Europe. In doing so, the Aussie pair fails to cheer broad US Dollar strength amid fears of softer economic growth in Australia.
While portraying the same, the AUD/USD pair prints a bearish flag chart pattern on the hourly timeframe.
Apart from the bearish chart formation, a near 50.0 level of the RSI (14) line allows the Aussie pair sellers to keep the reins.
That said, a convergence of the 50-Hour Moving Average (HMA) and an ascending support line from Friday restricts the AUD/USD pair’s immediate downside to around 0.6530 within the flag.
Following that, the 0.6510 level will be the key as a break of which confirms the bearish chart formation, making it vulnerable to refreshing the yearly low, currently around 0.6490.
It’s worth noting that the bear flag confirmation hints at a theoretical target of around 0.6340.
Meanwhile, the AUD/USD pair’s corrective bounce needs to cross the stated flag’s top line, close to 0.6560 at the latest.
Even so, the 200-HMA and a one-week-old descending resistance line, near 0.6615 by the press time, could challenge the Aussie bulls before giving them control.
Trend: Further downside expected
Technical Levels: Supports and Resistances
AUDUSD currently trading at 0.6516 at the time of writing. Pair opened at 0.6538 and is trading with a change of -0.34% % .
| Overview | Overview.1 | |
|---|---|---|
| 0 | Today last price | 0.6516 |
| 1 | Today Daily Change | -0.0022 |
| 2 | Today Daily Change % | -0.34% |
| 3 | Today daily open | 0.6538 |
The pair remains strongly bearish on the daily time frame. It trades below the 20 SMA @ 0.6655, 50 SMA 0.6673, 100 SMA @ 0.677 and 200 SMA @ 0.6703.
| Trends | Trends.1 | |
|---|---|---|
| 0 | Daily SMA20 | 0.6655 |
| 1 | Daily SMA50 | 0.6673 |
| 2 | Daily SMA100 | 0.6770 |
| 3 | Daily SMA200 | 0.6703 |
The previous day high was 0.6554 while the previous day low was 0.6514. The daily 38.2% Fib levels comes at 0.6539, expected to provide resistance. Similarly, the daily 61.8% fib level is at 0.653, expected to provide resistance.
Note the levels of interest below:
- Pivot support is noted at 0.6517, 0.6496, 0.6477
- Pivot resistance is noted at 0.6557, 0.6575, 0.6596
| Levels | Levels.1 |
|---|---|
| Previous Daily High | 0.6554 |
| Previous Daily Low | 0.6514 |
| Previous Weekly High | 0.6668 |
| Previous Weekly Low | 0.6490 |
| Previous Monthly High | 0.6806 |
| Previous Monthly Low | 0.6574 |
| Daily Fibonacci 38.2% | 0.6539 |
| Daily Fibonacci 61.8% | 0.6530 |
| Daily Pivot Point S1 | 0.6517 |
| Daily Pivot Point S2 | 0.6496 |
| Daily Pivot Point S3 | 0.6477 |
| Daily Pivot Point R1 | 0.6557 |
| Daily Pivot Point R2 | 0.6575 |
| Daily Pivot Point R3 | 0.6596 |
[/s2If]
Nehcap Expert Advisor
The NEHCAP MT4 EA is high quality professional trading system geared to generate returns without using GRID or martingales. Each trade has strict risk per trade parameter. The pairs under management include EURUSD, GBPUSD, AUDCAD, AUDNZD,GBPAUD, EURAUD, EURCAD, CHFJPY and many more.
The system is trading live: LIVE ACCOUNT TRACKING
You can run it free. Apply for a free trial and track our account. Buy the system or use profit share mechanism to generate returns on your MT4.
Join Our Telegram Group


