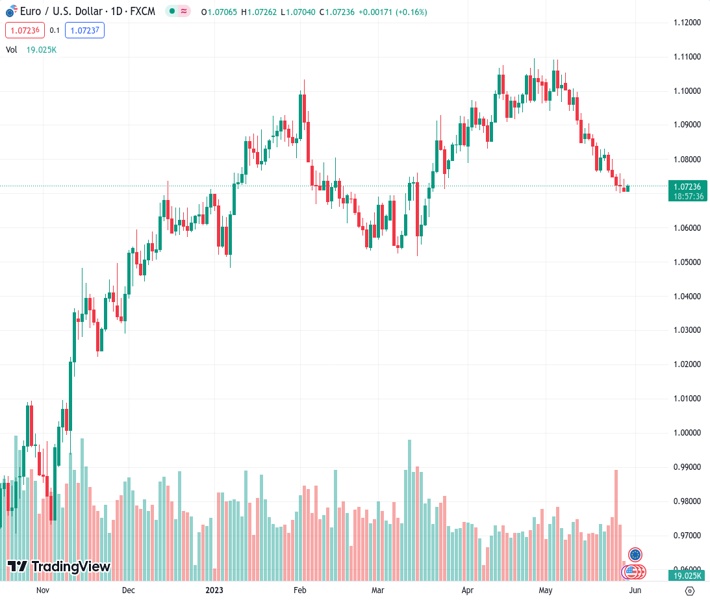
#EURUSD @ 1.07227 has shown a decent recovery from 1.0700 after witnessing sheer volatility in the USD index. (Pivot Orderbook analysis)
…
This is a premium post.
[s2If !current_user_can(access_s2member_level4)]Please register for FREE REGISTER to read full post below containing analysis. In case of any error or you think you are not able to read the full post below, please email us at support#nehcap.com [lwa][/s2If] [s2If current_user_can(access_s2member_level1)]
- EUR/USD has shown a decent recovery from 1.0700 after witnessing sheer volatility in the USD index.
- Eurozone headline and core inflation are seen declining to 6.3% and 5.5% respectively.
- EUR/USD is attempting a breakout of the Descending Triangle chart pattern.
The pair currently trades last at 1.07227.
The previous day high was 1.0744 while the previous day low was 1.0706. The daily 38.2% Fib levels comes at 1.072, expected to provide support. Similarly, the daily 61.8% fib level is at 1.0729, expected to provide resistance.
The EUR/USD pair has shown a decent recovery after defending its immediate support around 1.0700 in the Asian session. A recovery move in the major currency pair is being supported by a sell-off in the US Dollar Index (DXY). The USD index has slipped firmly below 104.20 as a raise in the US debt-ceiling is weighing heavily.
This week, the USD Index will be guided by the US Employment-linked economic indicators. From job openings to hiring figures, the entire gamut will portray current labor market conditions.
Meanwhile, the Euro bulls will also remain in action amid the release of the preliminary Eurozone inflation data (May). As per the consensus, headline inflation is seen declining to 6.3% vs. the former release of 7.0%. Core inflation is expected to show a minor deceleration to 5.5% against the prior release of 5.6%.
EUR/USD is attempting a breakout of the Descending Triangle chart pattern formed on an hourly scale. The downward-sloping trendline of the aforementioned chart pattern is potted from May 24 high around 1.0800. Horizontal support of the chart pattern is placed from May 25 low at 1.0707.
The shared currency pair has climbed above the 20-period Exponential Moving Average (EMA) at 1.0715 and is aiming to shift auction above the 50-EMA at 1.0724.
A break into the 60.00-80.00 range by the Relative Strength Index (RSI) (14) will trigger the upside momentum.
Should the asset break above the day’s high at 1.0726, Euro bulls would drive the major currency pair toward May 19 low at 1.0760. and the round-level resistance at 1.0800.
In an alternate scenario, the downside move will resume if the shared currency pair drops below the round-level support of 1.0700. This will drag the asset toward March 13 low at 1.0650 followed by March 03 low at 1.0588.
Technical Levels: Supports and Resistances
EURUSD currently trading at 1.0722 at the time of writing. Pair opened at 1.0708 and is trading with a change of 0.13 % .
| Overview | Overview.1 | |
|---|---|---|
| 0 | Today last price | 1.0722 |
| 1 | Today Daily Change | 0.0014 |
| 2 | Today Daily Change % | 0.1300 |
| 3 | Today daily open | 1.0708 |
The pair is trading below its 20 Daily moving average @ 1.0873, below its 50 Daily moving average @ 1.0903 , below its 100 Daily moving average @ 1.0816 and above its 200 Daily moving average @ 1.0487
| Trends | Trends.1 | |
|---|---|---|
| 0 | Daily SMA20 | 1.0873 |
| 1 | Daily SMA50 | 1.0903 |
| 2 | Daily SMA100 | 1.0816 |
| 3 | Daily SMA200 | 1.0487 |
The previous day high was 1.0744 while the previous day low was 1.0706. The daily 38.2% Fib levels comes at 1.072, expected to provide support. Similarly, the daily 61.8% fib level is at 1.0729, expected to provide resistance.
Note the levels of interest below:
- Pivot support is noted at 1.0695, 1.0681, 1.0657
- Pivot resistance is noted at 1.0733, 1.0757, 1.0771
| Levels | Levels.1 |
|---|---|
| Previous Daily High | 1.0744 |
| Previous Daily Low | 1.0706 |
| Previous Weekly High | 1.0831 |
| Previous Weekly Low | 1.0702 |
| Previous Monthly High | 1.1095 |
| Previous Monthly Low | 1.0788 |
| Daily Fibonacci 38.2% | 1.0720 |
| Daily Fibonacci 61.8% | 1.0729 |
| Daily Pivot Point S1 | 1.0695 |
| Daily Pivot Point S2 | 1.0681 |
| Daily Pivot Point S3 | 1.0657 |
| Daily Pivot Point R1 | 1.0733 |
| Daily Pivot Point R2 | 1.0757 |
| Daily Pivot Point R3 | 1.0771 |
[/s2If]
Nehcap Expert Advisor
The NEHCAP MT4 EA is high quality professional trading system geared to generate returns without using GRID or martingales. Each trade has strict risk per trade parameter. The pairs under management include EURUSD, GBPUSD, AUDCAD, AUDNZD,GBPAUD, EURAUD, EURCAD, CHFJPY and many more.
The system is trading live: LIVE ACCOUNT TRACKING
You can run it free. Apply for a free trial and track our account. Buy the system or use profit share mechanism to generate returns on your MT4.
Join Our Telegram Group


