#XAUUSD @ 1,943.07 Gold Price seesaws near intraday low as United States Treasury bond yields drop on full markets’ return., @nehcap view: Further downside expected (Pivot Orderbook analysis)
…
This is a premium post.
[s2If !current_user_can(access_s2member_level4)]Please register for FREE REGISTER to read full post below containing analysis. In case of any error or you think you are not able to read the full post below, please email us at support#nehcap.com [lwa][/s2If] [s2If current_user_can(access_s2member_level1)]
- Gold Price seesaws near intraday low as United States Treasury bond yields drop on full markets’ return.
- Challenges for United States debt ceiling agreement in being a law and turning down default woes prod XAU/USD bulls.
- Holidays in multiple markets previously allowed Gold Price to pare recent losses, bears can sneak in on fresh risk aversion.
- Full markets’ reaction to debt limit deal, mid-tier US data eyed for intraday XAU/USD directions.
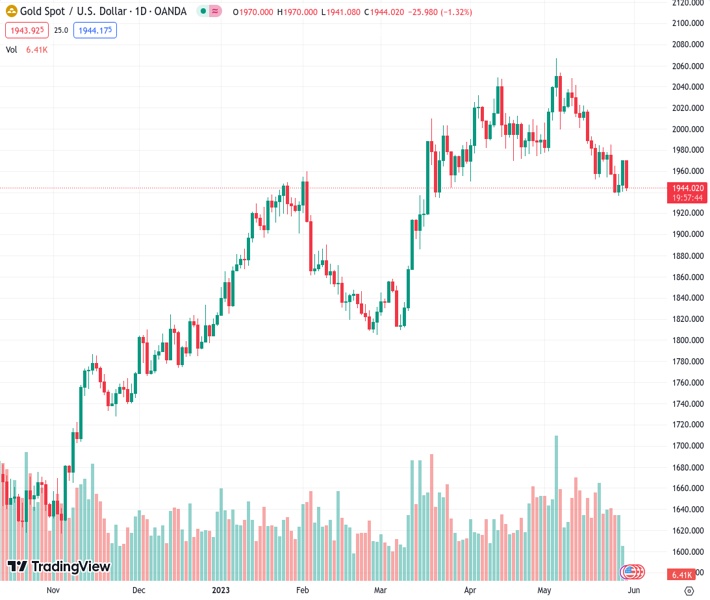
The pair currently trades last at 1943.07.
The previous day high was 1949.82 while the previous day low was 1940.36. The daily 38.2% Fib levels comes at 1943.97, expected to provide resistance. Similarly, the daily 61.8% fib level is at 1946.21, expected to provide resistance.
Gold price (XAU/USD) marks a zigzag move around the daily bottom near $1,940 as bears keep the reins, even with minor losses, amid the mid-Asia session on Tuesday.
In doing so, the precious metal bears the burden of the markets’ rush towards risk safety, which in turn underpins the US Dollar. However, the latest optimism in the bond markets, due to the first reaction to the United States policymakers’ agreement on extending the debt ceiling to avoid the default seems to have put a floor under the Gold price. That said, the XAU/USD bears occupy the driver’s seat amid challenges to sentiment, as well as due to the cautious mood ahead of the key data/events.
Gold price holds lower ground even as the United States Treasury bond yields portray the market’s optimism about the US policymakers’ deal on the debt-ceiling extension to January 2025. The reason for the XAU/USD weakness could be linked to the risk-negative signals from some of the policymakers, mostly Republicans, as they’re against the comprises made to reach the deal and stay ready to challenge the move in the House, as well as in the Senate.
“A handful of hard-right Republican lawmakers said on Monday they would oppose a deal to raise the United States’ $31.4 trillion debt ceiling, in a sign that the bipartisan agreement could face a rocky path through Congress before the U.S. runs out of money next week,” said Reuters.
That said, the United States 10-year Treasury bond yields dropped five basis points (bps) to 3.76% amid the initial hour of the week-start trading for the US bond markets, after Monday’s holiday.
Apart from the United States default fears, hawkish concerns about the Federal Reserve’s (Fed) next rate hike, backed by upbeat US data, also exert downside pressure on the Gold Price. That said, the upbeat prints of the US PMIs, Durable Goods Orders and Q1 GDP and inflation signals favor the market’s bullish bets on the interest rate futures suggesting a 0.25% Fed rate hike in June.
Additionally, fresh fears of the Eurozone recession, emanating from a downward revision to Germany’s first quarter (Q1) Gross Domestic Product (GDP) figures, join the US-China woes to also keep the Gold price depressed, via the market’s rush towards the US Dollar. Late on Monday, China turned down the US request for a meeting of the Defense Chiefs in Singapore, per the Wall Street Journal (WSJ).
Amid these plays, the US S&P500 Futures print mild gains around 4,225 and challenges the Gold price downside. It’s worth noting that the US Dollar Index (DXY) regains upside momentum after a struggle to renew the two-month high yesterday, which in turn weighs on the XAU/USD.
Moving on, developments about the US debt ceiling agreement and the US CB Consumer Confidence for May will be crucial for the Gold Price watchers to observe for intraday directions. Should there be risk-negative headlines from the political frontier, as well as upbeat US statistics, the Gold price may witness further downside depending upon the DXY’s capacity to remain firmer.
Also read: US Consumer Confidence Preview: Confidence remains down, but DXY aims up
Gold Price struggles to defend the bounce off the 2.5-month-old horizontal support zone surrounding $1,933-35 amid below-50.0 levels of the Relative Strength Index (RSI) line, placed at 14, which in turn suggests a lack of upside momentum.
Adding strength to the downside bias are the sluggish signals from the Moving Average Convergence and Divergence (MACD) indicator.
However, a clear break of the $1,935-33 area becomes necessary for the Gold seller’s conviction.
Following that, the $1,900 round figure and the mid-March swing low of around $1,885 can prod the XAU/USD bears before directing them toward the yearly low marked in late February at around $1,804.
Alternatively, the previous support line stretched from early April, near $1,955, follows the 61.8% Fibonacci retracement of the Gold Price moves between mid-March and early May, near $1,960, to restrict the short-term upside of the bullion.
Even if the XAU/USD manages to cross the $1,960 hurdle, a convergence of the 50-SMA and a four-week-old descending resistance line, near $1,965, appears crucial to challenge the Gold buyers, a break of which suggests a short-term upside of the precious metal.
Overall, the Gold Price is likely to grind lower despite the latest corrective bounce from the short-term key support.
Trend: Further downside expected
Technical Levels: Supports and Resistances
XAUUSD currently trading at 1941.53 at the time of writing. Pair opened at 1943.8 and is trading with a change of -0.12% % .
| Overview | Overview.1 | |
|---|---|---|
| 0 | Today last price | 1941.53 |
| 1 | Today Daily Change | -2.27 |
| 2 | Today Daily Change % | -0.12% |
| 3 | Today daily open | 1943.8 |
The pair is trading below its 20 Daily moving average @ 1994.66, below its 50 Daily moving average @ 1992.1 , above its 100 Daily moving average @ 1935.86 and above its 200 Daily moving average @ 1831.41
| Trends | Trends.1 | |
|---|---|---|
| 0 | Daily SMA20 | 1994.66 |
| 1 | Daily SMA50 | 1992.10 |
| 2 | Daily SMA100 | 1935.86 |
| 3 | Daily SMA200 | 1831.41 |
The previous day high was 1949.82 while the previous day low was 1940.36. The daily 38.2% Fib levels comes at 1943.97, expected to provide resistance. Similarly, the daily 61.8% fib level is at 1946.21, expected to provide resistance.
Note the levels of interest below:
- Pivot support is noted at 1939.5, 1935.2, 1930.04
- Pivot resistance is noted at 1948.96, 1954.12, 1958.42
| Levels | Levels.1 |
|---|---|
| Previous Daily High | 1949.82 |
| Previous Daily Low | 1940.36 |
| Previous Weekly High | 1985.30 |
| Previous Weekly Low | 1936.77 |
| Previous Monthly High | 2048.75 |
| Previous Monthly Low | 1949.83 |
| Daily Fibonacci 38.2% | 1943.97 |
| Daily Fibonacci 61.8% | 1946.21 |
| Daily Pivot Point S1 | 1939.50 |
| Daily Pivot Point S2 | 1935.20 |
| Daily Pivot Point S3 | 1930.04 |
| Daily Pivot Point R1 | 1948.96 |
| Daily Pivot Point R2 | 1954.12 |
| Daily Pivot Point R3 | 1958.42 |
[/s2If]
Nehcap Expert Advisor
The NEHCAP MT4 EA is high quality professional trading system geared to generate returns without using GRID or martingales. Each trade has strict risk per trade parameter. The pairs under management include EURUSD, GBPUSD, AUDCAD, AUDNZD,GBPAUD, EURAUD, EURCAD, CHFJPY and many more.
The system is trading live: LIVE ACCOUNT TRACKING
You can run it free. Apply for a free trial and track our account. Buy the system or use profit share mechanism to generate returns on your MT4.
Join Our Telegram Group


