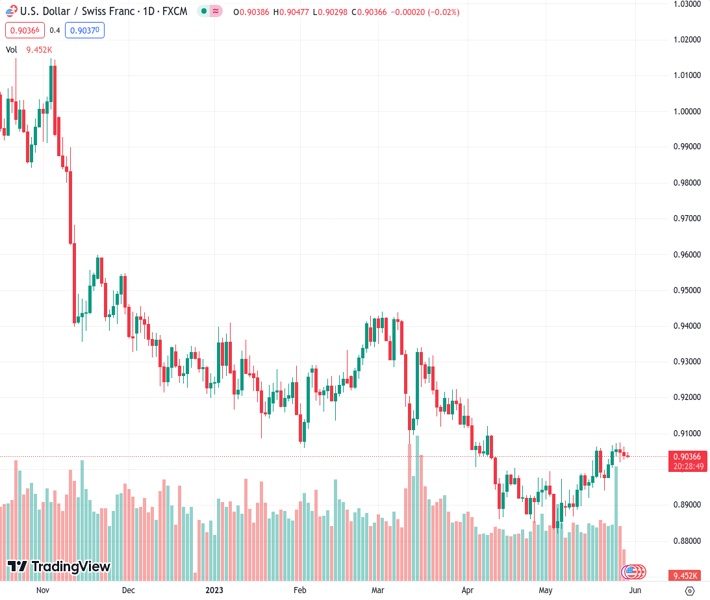
#USDCHF @ 0.90385 has faced selling pressure above 0.9045 amid sheer volatility in the USD Index. (Pivot Orderbook analysis)
…
This is a premium post.
[s2If !current_user_can(access_s2member_level4)]Please register for FREE REGISTER to read full post below containing analysis. In case of any error or you think you are not able to read the full post below, please email us at support#nehcap.com [lwa][/s2If] [s2If current_user_can(access_s2member_level1)]
- USD/CHF has faced selling pressure above 0.9045 amid sheer volatility in the USD Index.
- The USD Index is a rerating candidate as the street is anticipating one more interest rate hike from the Fed.
- USD/CHF is demonstrating an inventory adjustment phase after delivering a breakout of the Wyckoff Accumulation pattern.
The pair currently trades last at 0.90385.
The previous day high was 0.9062 while the previous day low was 0.9028. The daily 38.2% Fib levels comes at 0.9041, expected to provide resistance. Similarly, the daily 61.8% fib level is at 0.9049, expected to provide resistance.
The USD/CHF pair has dropped sharply after multiple attempts of shifting the auction profile above 0.9045 in the Asian session. The Swiss Franc asset has attracted significant offers as the US Dollar Index (DXY) has turned extremely volatile as United States investors are returning after an extended weekend on account of Memorial Day.
S&P500 futures have trimmed some gains in Tokyo, portraying a minor caution ahead of reaction from investors over the US debt-ceiling raise approval. The USD Index has shown a wild gyration in a 25-pip range as investors are anticipated to re-rate the asset amid a rebound in expectations for an interest rate hike by the Federal Reserve (Fed).
Meanwhile, the Swiss Franc will remain in action amid the release of the Swiss Q1 Gross Domestic Product (GDP) data. Quarterly GDP is seen expanding by 0.1% vs. a stagnant performance. On an annual basis, the GDP figure is seen landing at 0.6%, lower than the former release of 0.8%.
USD/CHF is demonstrating an inventory adjustment phase after delivering a breakout of the Wyckoff Accumulation pattern formed on a four-hour scale. Broadly, the Swiss franc asset is expected to display wider bullish ticks and heavy volume as bulls remain solid in the markup phase. Upward-sloping 50-period Exponential Moving Average (EMA) at 0.9024 is providing support to the US Dollar bulls.
A confident break into the bullish range of 60.00-80.00 by the Relative Strength Index (RSI) would strengthen US Dollar bulls further.
Going forward, a decisive break above the immediate resistance plotted on May 25 high at 0.9073 will drive the asset toward the round-level resistance of 0.9100 followed by March 28 low at 0.9137.
In an alternate scenario, a downside move below May 16 low at 0.8929 will drag the asset toward April 14 low at 0.8867. A slippage below April 14 low will further drag the asset toward the Spring formation around May 04 low at 0.8820.
Technical Levels: Supports and Resistances
USDCHF currently trading at 0.9036 at the time of writing. Pair opened at 0.9045 and is trading with a change of -0.1 % .
| Overview | Overview.1 | |
|---|---|---|
| 0 | Today last price | 0.9036 |
| 1 | Today Daily Change | -0.0009 |
| 2 | Today Daily Change % | -0.1000 |
| 3 | Today daily open | 0.9045 |
The pair is trading above its 20 Daily moving average @ 0.8965, above its 50 Daily moving average @ 0.9009 , below its 100 Daily moving average @ 0.9135 and below its 200 Daily moving average @ 0.9387
| Trends | Trends.1 | |
|---|---|---|
| 0 | Daily SMA20 | 0.8965 |
| 1 | Daily SMA50 | 0.9009 |
| 2 | Daily SMA100 | 0.9135 |
| 3 | Daily SMA200 | 0.9387 |
The previous day high was 0.9062 while the previous day low was 0.9028. The daily 38.2% Fib levels comes at 0.9041, expected to provide resistance. Similarly, the daily 61.8% fib level is at 0.9049, expected to provide resistance.
Note the levels of interest below:
- Pivot support is noted at 0.9028, 0.901, 0.8993
- Pivot resistance is noted at 0.9062, 0.9079, 0.9096
| Levels | Levels.1 |
|---|---|
| Previous Daily High | 0.9062 |
| Previous Daily Low | 0.9028 |
| Previous Weekly High | 0.9075 |
| Previous Weekly Low | 0.8941 |
| Previous Monthly High | 0.9198 |
| Previous Monthly Low | 0.8852 |
| Daily Fibonacci 38.2% | 0.9041 |
| Daily Fibonacci 61.8% | 0.9049 |
| Daily Pivot Point S1 | 0.9028 |
| Daily Pivot Point S2 | 0.9010 |
| Daily Pivot Point S3 | 0.8993 |
| Daily Pivot Point R1 | 0.9062 |
| Daily Pivot Point R2 | 0.9079 |
| Daily Pivot Point R3 | 0.9096 |
[/s2If]
Nehcap Expert Advisor
The NEHCAP MT4 EA is high quality professional trading system geared to generate returns without using GRID or martingales. Each trade has strict risk per trade parameter. The pairs under management include EURUSD, GBPUSD, AUDCAD, AUDNZD,GBPAUD, EURAUD, EURCAD, CHFJPY and many more.
The system is trading live: LIVE ACCOUNT TRACKING
You can run it free. Apply for a free trial and track our account. Buy the system or use profit share mechanism to generate returns on your MT4.
Join Our Telegram Group


