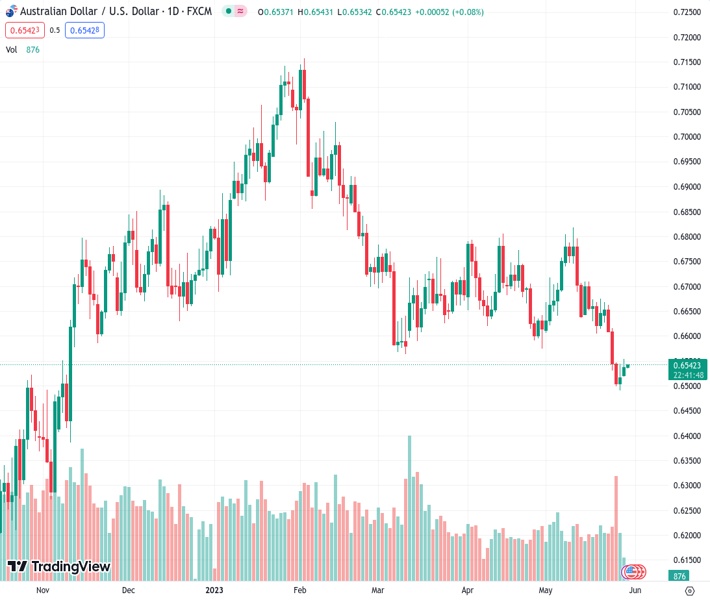
#AUDUSD @ 0.65432 edges higher after bouncing off the lowest levels in six months the previous day. (Pivot Orderbook analysis)
…
This is a premium post.
[s2If !current_user_can(access_s2member_level4)]Please register for FREE REGISTER to read full post below containing analysis. In case of any error or you think you are not able to read the full post below, please email us at support#nehcap.com [lwa][/s2If] [s2If current_user_can(access_s2member_level1)]
- AUD/USD edges higher after bouncing off the lowest levels in six months the previous day.
- Market sentiment improves on US debt limit extension agreement, denting US Dollar.
- Concerns about the passage of deal through Congress prod Aussie buyers.
- Off in multiple markets offered a rocky start to the key week, risk catalysts, second-tier data eyed for clear directions.
The pair currently trades last at 0.65432.
The previous day high was 0.6544 while the previous day low was 0.649. The daily 38.2% Fib levels comes at 0.6524, expected to provide support. Similarly, the daily 61.8% fib level is at 0.6511, expected to provide support.
AUD/USD dribbles around 0.6550 as it struggles to defend the last two-day rebound from a multi-week low amid early Tuesday. In doing so, the Aussie pair justifies its risk barometer status amid fresh challenges to the sentiment emanating from the US and China, as well as due to the return of the full markets.
Monday’s off in multiple markets restricted the reaction to the much-awaited US agreement on the debt ceiling extension. Even so, the US Dollar extends Friday’s downbeat performance amid firmer sentiment. However, some of the policymakers on both sides are against the compromises cited to reach the deal and hence raise doubts about its passage through the House and Senate during its voting on Wednesday and before June 05 deadline.
“A handful of hard-right Republican lawmakers said on Monday they would oppose a deal to raise the United States’ $31.4 trillion debt ceiling, in a sign that the bipartisan agreement could face a rocky path through Congress before the U.S. runs out of money next week,” said Reuters.
Apart from the US debt ceiling deal, the recent tension between Washington and Beijing also seems to prod the AUD/USD bulls. Recently, China turned down the US request for a meeting of the Defense Chiefs in Singapore, per the Wall Street Journal (WSJ).
Additionally, the recently hawkish Fed bias, backed by the US data, also prods the Aussie pair buyers even as the Reserve Bank of Australia (RBA) is also likely to trace the Reserve Bank of New Zealand’s (RBNZ) footsteps in announcing the rate hikes.
Amid these plays, markets were pretty quiet amid a lack of major data/events and the close of trading in multiple markets.
Looking forward, Aussie Building Permits for April and the US housing and mid-tier sentiment figures may entertain the AUD/USD traders. However, major attention will be given to the headlines suggesting the US debt ceiling deal’s passage through Congress before June 05.
A convergence of a three-week-old descending trend line and a previous support line from March 10, around 0.6575-80, appears a short-term key upside hurdle for the AUD/USD bulls to cross during further recovery.
Technical Levels: Supports and Resistances
AUDUSD currently trading at 0.6538 at the time of writing. Pair opened at 0.6514 and is trading with a change of 0.37% % .
| Overview | Overview.1 | |
|---|---|---|
| 0 | Today last price | 0.6538 |
| 1 | Today Daily Change | 0.0024 |
| 2 | Today Daily Change % | 0.37% |
| 3 | Today daily open | 0.6514 |
The pair remains strongly bearish on the daily time frame. It trades below the 20 SMA @ 0.666, 50 SMA 0.6677, 100 SMA @ 0.6774 and 200 SMA @ 0.6704.
| Trends | Trends.1 | |
|---|---|---|
| 0 | Daily SMA20 | 0.6660 |
| 1 | Daily SMA50 | 0.6677 |
| 2 | Daily SMA100 | 0.6774 |
| 3 | Daily SMA200 | 0.6704 |
The previous day high was 0.6544 while the previous day low was 0.649. The daily 38.2% Fib levels comes at 0.6524, expected to provide support. Similarly, the daily 61.8% fib level is at 0.6511, expected to provide support.
Note the levels of interest below:
- Pivot support is noted at 0.6489, 0.6463, 0.6435
- Pivot resistance is noted at 0.6542, 0.657, 0.6596
| Levels | Levels.1 |
|---|---|
| Previous Daily High | 0.6544 |
| Previous Daily Low | 0.6490 |
| Previous Weekly High | 0.6668 |
| Previous Weekly Low | 0.6490 |
| Previous Monthly High | 0.6806 |
| Previous Monthly Low | 0.6574 |
| Daily Fibonacci 38.2% | 0.6524 |
| Daily Fibonacci 61.8% | 0.6511 |
| Daily Pivot Point S1 | 0.6489 |
| Daily Pivot Point S2 | 0.6463 |
| Daily Pivot Point S3 | 0.6435 |
| Daily Pivot Point R1 | 0.6542 |
| Daily Pivot Point R2 | 0.6570 |
| Daily Pivot Point R3 | 0.6596 |
[/s2If]
Nehcap Expert Advisor
The NEHCAP MT4 EA is high quality professional trading system geared to generate returns without using GRID or martingales. Each trade has strict risk per trade parameter. The pairs under management include EURUSD, GBPUSD, AUDCAD, AUDNZD,GBPAUD, EURAUD, EURCAD, CHFJPY and many more.
The system is trading live: LIVE ACCOUNT TRACKING
You can run it free. Apply for a free trial and track our account. Buy the system or use profit share mechanism to generate returns on your MT4.
Join Our Telegram Group


