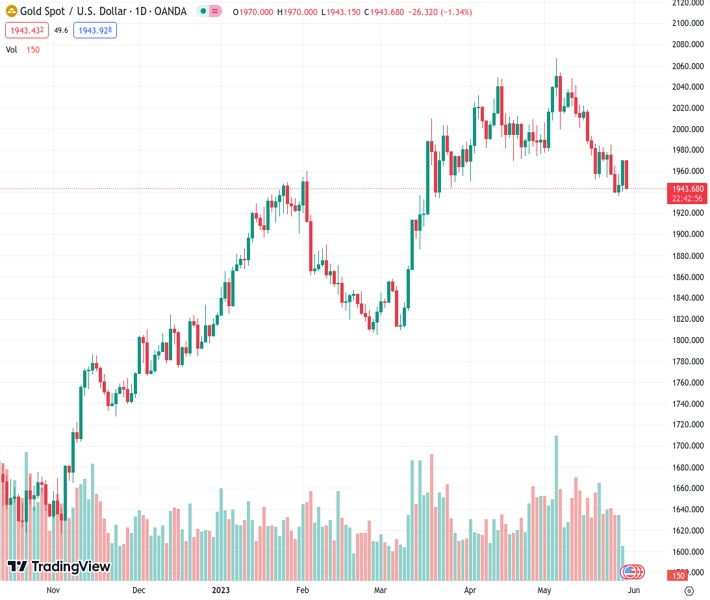
#XAUUSD @ 1,943.59 Gold price has shown topsy-turvy moves above $1,943.00 amid a less volatile action due to the long weekend. (Pivot Orderbook analysis)
…
This is a premium post.
[s2If !current_user_can(access_s2member_level4)]Please register for FREE REGISTER to read full post below containing analysis. In case of any error or you think you are not able to read the full post below, please email us at support#nehcap.com [lwa][/s2If] [s2If current_user_can(access_s2member_level1)]
- Gold price has shown topsy-turvy moves above $1,943.00 amid a less volatile action due to the long weekend.
- Fresh incoming data from US economic indicators are hinting at a sharp rise in demand-pull inflation.
- Gold price has again shifted into a volatility contraction and is expected to deliver more downside ahead.
The pair currently trades last at 1943.59.
The previous day high was 1957.33 while the previous day low was 1936.77. The daily 38.2% Fib levels comes at 1949.48, expected to provide resistance. Similarly, the daily 61.8% fib level is at 1944.62, expected to provide resistance.
Gold price (XAU/USD) is displaying topsy-turvy moves above $1,943.00 in the early Asian session. The precious metal is expected to extend its downside journey after an intermediate inventory adjustment phase as the Federal Reserve (Fed) is expected to make more interest rate hikes in June meeting certain amid resilient households’ spending in the United States.
Earlier, Fed chair Jerome Powell cited that more rate hikes seem less certain as tight credit conditions by US regional banks are effectively restricting inflation. However, fresh incoming data from economic indicators is hinting at a sharp rise in demand-pull inflation.
S&P500 futures are showing gains in early Asia, portraying a risk appetite theme as fears of a default by the US economy have receded. US President Joe Biden made clear on Monday that the agreed proposal between the White House and Republicans is going to Congress for voting before the deadline of June 05.
The US Dollar Index (DXY) is facing barricades in extending its recovery above 104.30. Investors should brace for a volatile action ahead as US markets will open after a long weekend, therefore, investors would first wrap up their positions. Apart from that, investors would shift their focus towards JOLTS Jobs Openings data, which will release on Wednesday along with Fed’s Beige Book. As per the consensus, job openings are expected to fall to 9.35M vs. the prior release of 9.59M.
Gold price displayed a downside move after a breakdown of the Symmetrical Triangle chart pattern on an hourly scale. The precious metal has sensed immense selling pressure after a pullback move to near $1,957.82. The yellow metal has again shifted into a volatility contraction and is expected to deliver more downside ahead.
The 50-period Exponential Moving Average (EMA) at $1,948.00 is barricading the upside of the Gold price.
Meanwhile, the Relative Strength Index (RSI) (14) is oscillating in the 40.00-60.00 range. A breakdown below 40.00 will trigger the downside momentum.
Technical Levels: Supports and Resistances
XAUUSD currently trading at 1943.8 at the time of writing. Pair opened at 1946.62 and is trading with a change of -0.14 % .
| Overview | Overview.1 | |
|---|---|---|
| 0 | Today last price | 1943.80 |
| 1 | Today Daily Change | -2.82 |
| 2 | Today Daily Change % | -0.14 |
| 3 | Today daily open | 1946.62 |
The pair is trading below its 20 Daily moving average @ 1996.59, below its 50 Daily moving average @ 1993.01 , above its 100 Daily moving average @ 1935.1 and above its 200 Daily moving average @ 1830.43
| Trends | Trends.1 | |
|---|---|---|
| 0 | Daily SMA20 | 1996.59 |
| 1 | Daily SMA50 | 1993.01 |
| 2 | Daily SMA100 | 1935.10 |
| 3 | Daily SMA200 | 1830.43 |
The previous day high was 1957.33 while the previous day low was 1936.77. The daily 38.2% Fib levels comes at 1949.48, expected to provide resistance. Similarly, the daily 61.8% fib level is at 1944.62, expected to provide resistance.
Note the levels of interest below:
- Pivot support is noted at 1936.48, 1926.35, 1915.92
- Pivot resistance is noted at 1957.04, 1967.47, 1977.6
| Levels | Levels.1 |
|---|---|
| Previous Daily High | 1957.33 |
| Previous Daily Low | 1936.77 |
| Previous Weekly High | 1985.30 |
| Previous Weekly Low | 1936.77 |
| Previous Monthly High | 2048.75 |
| Previous Monthly Low | 1949.83 |
| Daily Fibonacci 38.2% | 1949.48 |
| Daily Fibonacci 61.8% | 1944.62 |
| Daily Pivot Point S1 | 1936.48 |
| Daily Pivot Point S2 | 1926.35 |
| Daily Pivot Point S3 | 1915.92 |
| Daily Pivot Point R1 | 1957.04 |
| Daily Pivot Point R2 | 1967.47 |
| Daily Pivot Point R3 | 1977.60 |
[/s2If]
Nehcap Expert Advisor
The NEHCAP MT4 EA is high quality professional trading system geared to generate returns without using GRID or martingales. Each trade has strict risk per trade parameter. The pairs under management include EURUSD, GBPUSD, AUDCAD, AUDNZD,GBPAUD, EURAUD, EURCAD, CHFJPY and many more.
The system is trading live: LIVE ACCOUNT TRACKING
You can run it free. Apply for a free trial and track our account. Buy the system or use profit share mechanism to generate returns on your MT4.
Join Our Telegram Group


