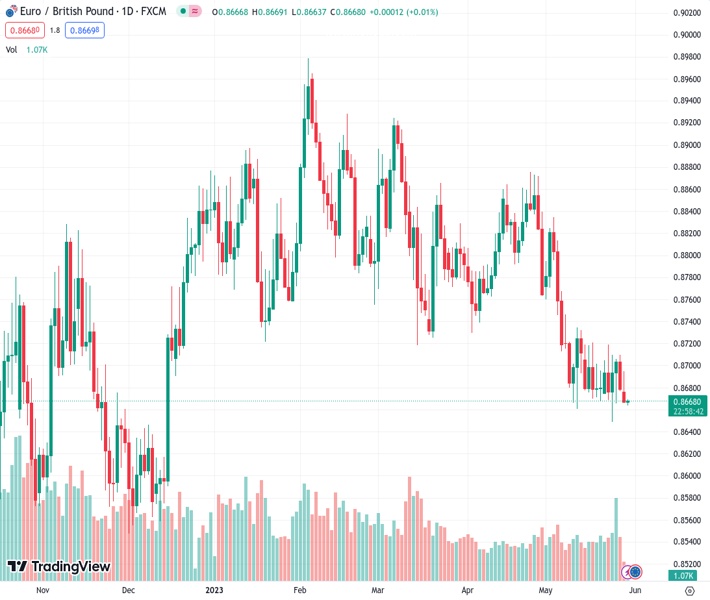
#EURGBP @ 0.86666 is resuming its downward trend, edging closer to its yearly low, signaling potential bearish momentum in the pair. (Pivot Orderbook analysis)
…
This is a premium post.
[s2If !current_user_can(access_s2member_level4)]Please register for FREE REGISTER to read full post below containing analysis. In case of any error or you think you are not able to read the full post below, please email us at support#nehcap.com [lwa][/s2If] [s2If current_user_can(access_s2member_level1)]
- EUR/GBP is resuming its downward trend, edging closer to its yearly low, signaling potential bearish momentum in the pair.
- The current trend remains undecided below the 0.8700 resistance, awaiting a clear direction pressured down by failing German Yields.
- Market awaits ECB President Lagarde’s speech and German inflation data on Wednesday for potential developments.
The pair currently trades last at 0.86666.
The previous day high was 0.871 while the previous day low was 0.8677. The daily 38.2% Fib levels comes at 0.8689, expected to provide resistance. Similarly, the daily 61.8% fib level is at 0.8697, expected to provide resistance.
The Euro is currently experiencing widespread losses and depreciation, which is having an impact on its pairs against the US Dollar, Japanese Yen and the Swiss Franc.
The EUR/GBP pair is showing a resumption of its downward trend, getting closer to its yearly low and indicating a potential bearish momentum. With the pair’s trend remaining uncertain below the 0.8670 zone, market participants are awaiting ECB President Lagarde’s upcoming speech and German inflation data on Wednesday for possible developments that could provide clarity and influence the market’s direction.On Tuesday, Spanish inflation data, released by the National Statistics Institute may also have an impact on the Euro price dynamics.
German yields decreased on Monday. The 10-year bond yield stands at 2.43%, showing a minor decline of 0.08%. The 2-year yield is at 2.90% with losses of 0.5%, while the 5-year yield is at 2.46% with limited losses of 0.08%. Conversely, British yields rose. The 10-year bond yield reached 4.37% with gains of 0.87%, the 2-year yield stands at 4.55% with gains of 1.35%, and the 5-year yield is at 4.34% with gains of 1.51%.
On Wednesday, Destatis will release inflation figures from Germany which are expected to have further decelerated in May. In that sense, the inflationary figures for the biggest economic block from the Eurozone may have an impact on the Euro against major currency counterparts.
According to the daily chart, the EUR/GBP pair maintains a neutral-to-bearish outlook in the short term, as the bears have seemingly retreated while the market enters a phase of consolidation. However, technical indicators continue to show negativity, suggesting the potential for further downward movement.
In the event of a decline in the EUR/GBP exchange rate, immediate support levels are observed at the 0.8660 zone, followed by the yearly low at 0.8645 and 0.8600 level. On the other hand, upcoming resistance levels for EUR/GBP are anticipated at the 0.8700 level, followed by the zone at 0.8725 and the 100-day Simple Moving Average (SMA) at 0.8750.
Technical Levels: Supports and Resistances
EURGBP currently trading at 0.8668 at the time of writing. Pair opened at 0.8685 and is trading with a change of -0.2 % .
| Overview | Overview.1 | |
|---|---|---|
| 0 | Today last price | 0.8668 |
| 1 | Today Daily Change | -0.0017 |
| 2 | Today Daily Change % | -0.2000 |
| 3 | Today daily open | 0.8685 |
The pair remains strongly bearish on the daily time frame. It trades below the 20 SMA @ 0.8715, 50 SMA 0.8769, 100 SMA @ 0.8803 and 200 SMA @ 0.8751.
| Trends | Trends.1 | |
|---|---|---|
| 0 | Daily SMA20 | 0.8715 |
| 1 | Daily SMA50 | 0.8769 |
| 2 | Daily SMA100 | 0.8803 |
| 3 | Daily SMA200 | 0.8751 |
The previous day high was 0.871 while the previous day low was 0.8677. The daily 38.2% Fib levels comes at 0.8689, expected to provide resistance. Similarly, the daily 61.8% fib level is at 0.8697, expected to provide resistance.
Note the levels of interest below:
- Pivot support is noted at 0.8671, 0.8658, 0.8638
- Pivot resistance is noted at 0.8704, 0.8724, 0.8737
| Levels | Levels.1 |
|---|---|
| Previous Daily High | 0.8710 |
| Previous Daily Low | 0.8677 |
| Previous Weekly High | 0.8719 |
| Previous Weekly Low | 0.8649 |
| Previous Monthly High | 0.8875 |
| Previous Monthly Low | 0.8729 |
| Daily Fibonacci 38.2% | 0.8689 |
| Daily Fibonacci 61.8% | 0.8697 |
| Daily Pivot Point S1 | 0.8671 |
| Daily Pivot Point S2 | 0.8658 |
| Daily Pivot Point S3 | 0.8638 |
| Daily Pivot Point R1 | 0.8704 |
| Daily Pivot Point R2 | 0.8724 |
| Daily Pivot Point R3 | 0.8737 |
[/s2If]
Nehcap Expert Advisor
The NEHCAP MT4 EA is high quality professional trading system geared to generate returns without using GRID or martingales. Each trade has strict risk per trade parameter. The pairs under management include EURUSD, GBPUSD, AUDCAD, AUDNZD,GBPAUD, EURAUD, EURCAD, CHFJPY and many more.
The system is trading live: LIVE ACCOUNT TRACKING
You can run it free. Apply for a free trial and track our account. Buy the system or use profit share mechanism to generate returns on your MT4.
Join Our Telegram Group


