#XAGUSD @ 23.151 Silver prices wrestle with a $23.37 resistance, nudging the towards daily lows as sellers eye lower targets amidst bearish indicators. (Pivot Orderbook analysis)
…
This is a premium post.
[s2If !current_user_can(access_s2member_level4)]Please register for FREE REGISTER to read full post below containing analysis. In case of any error or you think you are not able to read the full post below, please email us at support#nehcap.com [lwa][/s2If] [s2If current_user_can(access_s2member_level1)]
- Silver prices wrestle with a $23.37 resistance, nudging the XAG/USD towards daily lows as sellers eye lower targets amidst bearish indicators.
- Despite achieving a double-top objective, XAG/USD continues to face downward pressure; a fall below $23.00 could spur further losses.
- Overcoming the 100-day EMA at $23.46 could set the XAG/USD against resistances at $23.50 and the $23.90/$23.97 EMA intersection, eventually aiming for $24.00.
The pair currently trades last at 23.151.
The previous day high was 23.34 while the previous day low was 22.68. The daily 38.2% Fib levels comes at 23.09, expected to provide support. Similarly, the daily 61.8% fib level is at 22.93, expected to provide support.
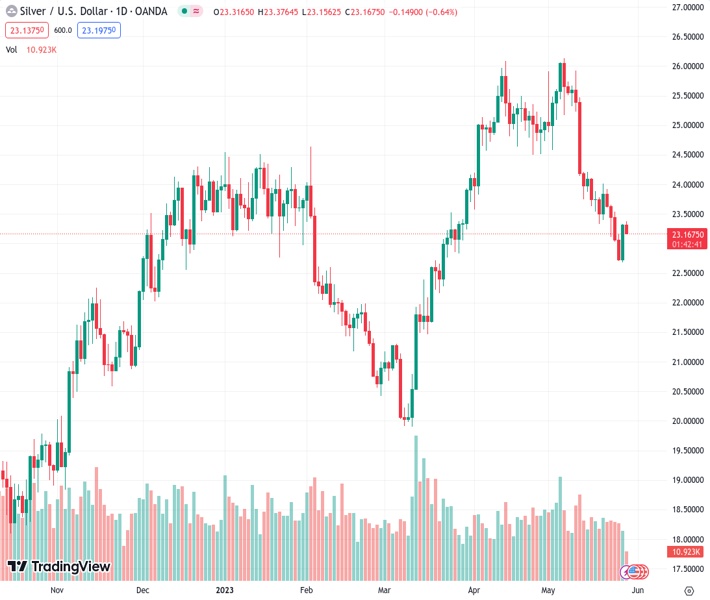
Silver price faces solid resistance around the $23.37 area as the 100-day Exponential Moving Average (EMA) sits around $23.46, pushing the XAG/USD spot price toward its daily lows of $23.15, with sellers eyeing lower prices. In addition, technical indicators turned bearish, with further downward action expected. At the time of writing, the XAG/USD is trading at $23.16.
From a technical point of view, XAG/USD is neutral to downward biased, capped on the upside by strong resistance levels. Even though the double-top measured objective was achieved on May 25, piercing below the $23.00 figure, downward pressure continues to mount on the white metal. Nevertheless, last Friday, profit-taking by sellers lifted the XAG/USD above $23.00.
The XAG/USD must drop below the $23.00 mark for a bearish continuation. A breach of the latter will expose the last week’s low of $22.68, followed by the March 21 low of $22.14. that could exacerbate further losses toward the $22.00 figure.
In contrast, if XAG/USD pierces the 100-day EMA at $23.46, the next line resistance would be $23.50, followed by the intersection of the 20 and 50-day EMAs at $23.90/$23.97, immediately followed by $24.00.
Technical Levels: Supports and Resistances
XAGUSD currently trading at 23.18 at the time of writing. Pair opened at 23.31 and is trading with a change of -0.56 % .
| Overview | Overview.1 | |
|---|---|---|
| 0 | Today last price | 23.18 |
| 1 | Today Daily Change | -0.13 |
| 2 | Today Daily Change % | -0.56 |
| 3 | Today daily open | 23.31 |
The pair is trading below its 20 Daily moving average @ 24.38, below its 50 Daily moving average @ 24.37 , below its 100 Daily moving average @ 23.37 and above its 200 Daily moving average @ 22.01
| Trends | Trends.1 | |
|---|---|---|
| 0 | Daily SMA20 | 24.38 |
| 1 | Daily SMA50 | 24.37 |
| 2 | Daily SMA100 | 23.37 |
| 3 | Daily SMA200 | 22.01 |
The previous day high was 23.34 while the previous day low was 22.68. The daily 38.2% Fib levels comes at 23.09, expected to provide support. Similarly, the daily 61.8% fib level is at 22.93, expected to provide support.
Note the levels of interest below:
- Pivot support is noted at 22.88, 22.46, 22.23
- Pivot resistance is noted at 23.54, 23.77, 24.19
| Levels | Levels.1 |
|---|---|
| Previous Daily High | 23.34 |
| Previous Daily Low | 22.68 |
| Previous Weekly High | 23.92 |
| Previous Weekly Low | 22.68 |
| Previous Monthly High | 26.09 |
| Previous Monthly Low | 23.57 |
| Daily Fibonacci 38.2% | 23.09 |
| Daily Fibonacci 61.8% | 22.93 |
| Daily Pivot Point S1 | 22.88 |
| Daily Pivot Point S2 | 22.46 |
| Daily Pivot Point S3 | 22.23 |
| Daily Pivot Point R1 | 23.54 |
| Daily Pivot Point R2 | 23.77 |
| Daily Pivot Point R3 | 24.19 |
[/s2If]
Nehcap Expert Advisor
The NEHCAP MT4 EA is high quality professional trading system geared to generate returns without using GRID or martingales. Each trade has strict risk per trade parameter. The pairs under management include EURUSD, GBPUSD, AUDCAD, AUDNZD,GBPAUD, EURAUD, EURCAD, CHFJPY and many more.
The system is trading live: LIVE ACCOUNT TRACKING
You can run it free. Apply for a free trial and track our account. Buy the system or use profit share mechanism to generate returns on your MT4.
Join Our Telegram Group


