#XAUUSD @ 1,946.26 Gold bounces and shows signs of resilience despite a strong US dollar, as lower US Treasury bond yields lend some support amidst the backdrop of US Memorial Day and European holidays. (Pivot Orderbook analysis)
…
This is a premium post.
[s2If !current_user_can(access_s2member_level4)]Please register for FREE REGISTER to read full post below containing analysis. In case of any error or you think you are not able to read the full post below, please email us at support#nehcap.com [lwa][/s2If] [s2If current_user_can(access_s2member_level1)]
- Gold bounces and shows signs of resilience despite a strong US dollar, as lower US Treasury bond yields lend some support amidst the backdrop of US Memorial Day and European holidays.
- Optimism soars amongst investors following a provisional deal between the White House and US Congress to raise the US debt ceiling.
- Positive US economic data spurred a hawkish repricing of the US Federal Reserve.
The pair currently trades last at 1946.26.
The previous day high was 1957.33 while the previous day low was 1936.77. The daily 38.2% Fib levels comes at 1949.48, expected to provide resistance. Similarly, the daily 61.8% fib level is at 1944.62, expected to provide support.
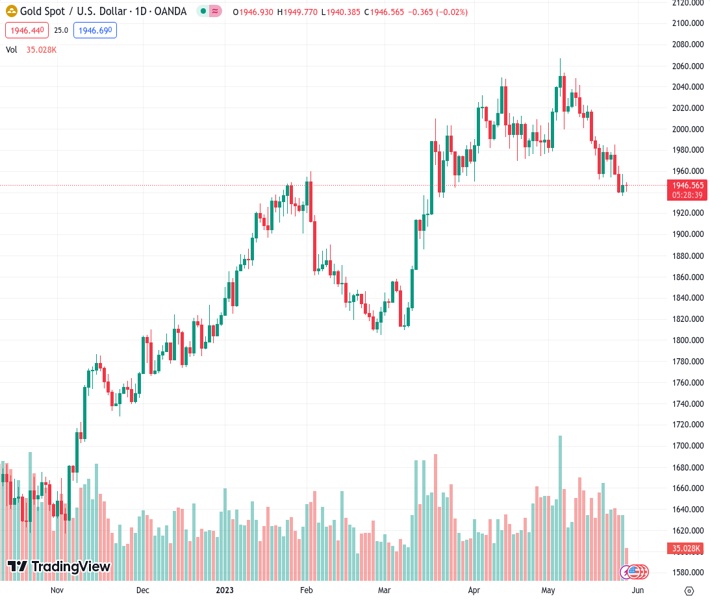
Gold price pares some of its fall of almost 2% last week, bouncing off from the $1940 area amidst thin liquidity conditions due to US Memorial Day and holidays across Europe. Lower US Treasury bond yields underpin XAU/USD, though a solid US Dollar (USD) caps its rally. The XAU/USD is trading at $1947, above its opening price by 0.08%.
Sentiment amongst investors turned positive after a deal was reached between the White House (WH) and the US Congress. However, it remains subject to a vote as soon as possible, which would raise the US debt ceiling by two years until January 1, 2025. That keeps US equity futures positive, though the greenback is also up, as bets that the US Federal Reserve (Fed) will lift rates in June rose from 25.7% a week ago to 58.4% Today.
The reasons behind a “hawkish” repricing of the US Federal Reserve (Fed), come after solid Retail Sales, Industrial Production, and upward revision of the Gross Domestic Product (GDP) flashed signs of resiliency in the economy of the United States (US). That alongside the last week’s review of the Fed’s preferred gauge for inflation, the Core PCE stood at around the high 4%.
Therefore, US Treasury bond yields, particularly the 10-year benchmark note rate, edged toward 3.859% before reversing its course, down to 3.796%, a tailwind for Gold prices.
During the weekend, the Chicago Fed President Austan Goolsbee said the Fed is improving on its inflation goal but has not succeeded, adding that interest rate increases take months or years to be felt by the economy. He added that the Fed can get inflation down without a recession.
XAU/USD’s daily chart portrays the yellow metal as neutral biased, trapped within the boundaries of the 100-day Exponential Moving Average (EMA) at $1934.21 and the 50-day EMA at $1972.45. In addition, the $1950 psychological price level was used as solid support that capped Gold’s fall until May 24, when it gave way to lower prices. That said, the bulls must reclaim the latter for a bullish continuation. On the downside, if XAU/USD cracks $1940, it could dive and test the 100-day EMA; before aiming toward the 200-day EMA at $1883.95.
Technical Levels: Supports and Resistances
XAUUSD currently trading at 1946.85 at the time of writing. Pair opened at 1946.62 and is trading with a change of 0.01 % .
| Overview | Overview.1 | |
|---|---|---|
| 0 | Today last price | 1946.85 |
| 1 | Today Daily Change | 0.23 |
| 2 | Today Daily Change % | 0.01 |
| 3 | Today daily open | 1946.62 |
The pair is trading below its 20 Daily moving average @ 1996.59, below its 50 Daily moving average @ 1993.01 , above its 100 Daily moving average @ 1935.1 and above its 200 Daily moving average @ 1830.43
| Trends | Trends.1 | |
|---|---|---|
| 0 | Daily SMA20 | 1996.59 |
| 1 | Daily SMA50 | 1993.01 |
| 2 | Daily SMA100 | 1935.10 |
| 3 | Daily SMA200 | 1830.43 |
The previous day high was 1957.33 while the previous day low was 1936.77. The daily 38.2% Fib levels comes at 1949.48, expected to provide resistance. Similarly, the daily 61.8% fib level is at 1944.62, expected to provide support.
Note the levels of interest below:
- Pivot support is noted at 1936.48, 1926.35, 1915.92
- Pivot resistance is noted at 1957.04, 1967.47, 1977.6
| Levels | Levels.1 |
|---|---|
| Previous Daily High | 1957.33 |
| Previous Daily Low | 1936.77 |
| Previous Weekly High | 1985.30 |
| Previous Weekly Low | 1936.77 |
| Previous Monthly High | 2048.75 |
| Previous Monthly Low | 1949.83 |
| Daily Fibonacci 38.2% | 1949.48 |
| Daily Fibonacci 61.8% | 1944.62 |
| Daily Pivot Point S1 | 1936.48 |
| Daily Pivot Point S2 | 1926.35 |
| Daily Pivot Point S3 | 1915.92 |
| Daily Pivot Point R1 | 1957.04 |
| Daily Pivot Point R2 | 1967.47 |
| Daily Pivot Point R3 | 1977.60 |
[/s2If]
Nehcap Expert Advisor
The NEHCAP MT4 EA is high quality professional trading system geared to generate returns without using GRID or martingales. Each trade has strict risk per trade parameter. The pairs under management include EURUSD, GBPUSD, AUDCAD, AUDNZD,GBPAUD, EURAUD, EURCAD, CHFJPY and many more.
The system is trading live: LIVE ACCOUNT TRACKING
You can run it free. Apply for a free trial and track our account. Buy the system or use profit share mechanism to generate returns on your MT4.
Join Our Telegram Group


