Oil price finds a floor after Republicans and Democrats agree a deal to extend the US government debt ceiling on Sunday.
…
This is a premium post.
[s2If !current_user_can(access_s2member_level4)]Please register for FREE REGISTER to read full post below containing analysis. In case of any error or you think you are not able to read the full post below, please email us at support#nehcap.com [lwa][/s2If] [s2If current_user_can(access_s2member_level1)]
- Oil price finds a floor after Republicans and Democrats agree a deal to extend the US government debt ceiling on Sunday.
- The deal means a default is unlikely and boosts demand prospects in the US.
- US interest rates are expected to rise further after debt deal and strong US macro data.
- Higher interest rates, however, will strengthen the US Dollar but weigh on Oil.
Oil price remains in a familiar range within the $72s on Monday, as traders in both the US and UK take a break to enjoy the bank-holiday weekend. WTI Oil is finding support from the news US lawmakers have agreed to extend the US debt ceiling, subject to a vote in Congress. Yet this has also had the effect of raising interest rate expectations – a factor weighing on Oil price. Higher interest rates will lead to a stronger US Dollar, putting pressure on Oil price, which is priced in Dollars.
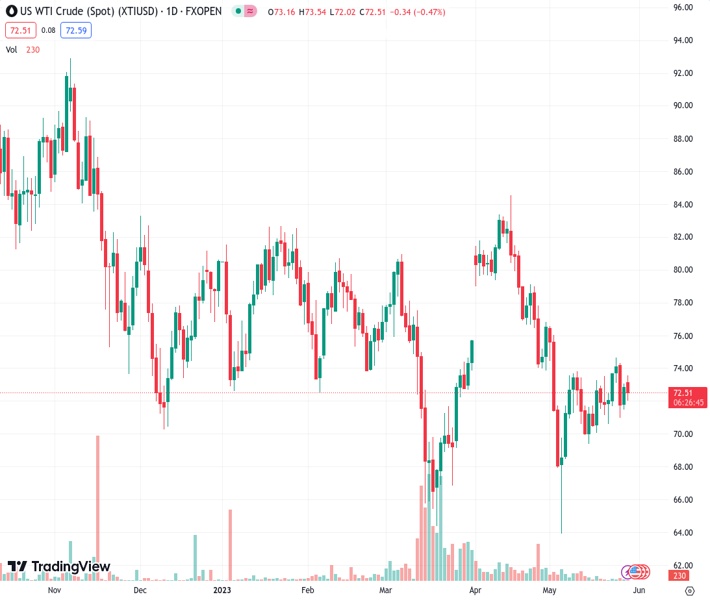
At the time of writing, WTI Oil is trading in the mid $72s and Brent Crude Oil in the mid $76s.
WTI Oil is in a long-term downtrend from a technical perspective, making successive lower lows. Given the old adage that the trend is your friend, this favors short positions over long positions. WTI Oil is trading below all the major daily Simple Moving Averages (SMA) and all the weekly SMAs except the 200-week, which is at $66.90.
WTI US Oil: Daily Chart
A right-angled triangle has probably finished forming as shown by the dotted lines on the chart above.
The triangle initially broke out to the upside, with price breaking above the upper border of the triangle on May 24 but then failed to follow-through higher and reversed. It is currently trading just below the lower border.
A breakout higher is still possible. The three green up bars in a row that occurred prior to the bullish breakout on May 24 are a bullish sign in themselves. It suggests there is still a chance price could recover after the May 25 sell-off and eventually continue breaking out higher.
Such a bullish breakout could see Oil price rise in a volatile rally to a potential target in the $79.70s, calculated by using the usual technical method, which is to take 61.8% of the height of the triangle and extrapolate it from the breakout point higher. Oil price could even go as far as a 100% extrapolation, however, the 61.8% level roughly coincides with the 200-day SMA and the main trendline for the bear market, heightening its importance as a key resistance level.
Assuming Oil price reaches its target, a bullish break would also signify that price had surpassed the key $76.85 lower high of April 28, thereby, bringing the dominant bear trend into doubt.
The long hammer Japanese candlestick pattern that formed at the May 4 (and year-to-date) lows is a further sign that Oil price may have formed a strategic bottom.
Further, the mild bullish convergence between price and the Relative Strength Index (RSI) at the March and May 2023 lows – with price making a lower low in May that is not matched by a lower low in RSI – is a sign that bearish pressure is easing.
That said, until Oil price actually climbs back above the $74.70 May 24 highs there is still a possibility WTI Oil price could break out lower. A break below the May 22 lows of $70.65, or better still the $69.40 May 15 lows, would provide confirmation.
WTI US Oil: Weekly Chart
A break below the year-to-date (YTD) lows of $64.31 would imply a new lower low was forming, reigniting the downtrend. The next target from there would be at around $62.00, where trough lows from 2021 will come into play, followed by support at $57.50.
[/s2If]
Nehcap Expert Advisor
The NEHCAP MT4 EA is high quality professional trading system geared to generate returns without using GRID or martingales. Each trade has strict risk per trade parameter. The pairs under management include EURUSD, GBPUSD, AUDCAD, AUDNZD,GBPAUD, EURAUD, EURCAD, CHFJPY and many more.
The system is trading live: LIVE ACCOUNT TRACKING
You can run it free. Apply for a free trial and track our account. Buy the system or use profit share mechanism to generate returns on your MT4.
Join Our Telegram Group


