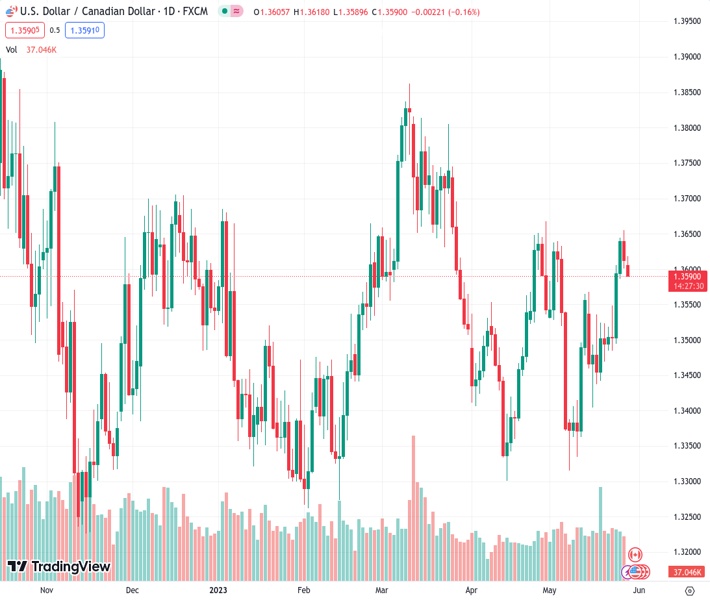
#USDCAD @ 1.35917 has shifted its auction below 1.3600 after a modification in the US debt structure. (Pivot Orderbook analysis)
…
This is a premium post.
[s2If !current_user_can(access_s2member_level4)]Please register for FREE REGISTER to read full post below containing analysis. In case of any error or you think you are not able to read the full post below, please email us at support#nehcap.com [lwa][/s2If] [s2If current_user_can(access_s2member_level1)]
- USD/CAD has shifted its auction below 1.3600 after a modification in the US debt structure.
- Fresh incoming data is advocating for more interest rate hikes by the Federal Reserve.
- Resilience in the Canadian economy could force the Bank of Canada to start hiking interest rates again.
- USD/CAD asset has dropped after facing barricades around the horizontal resistance placed from April 26 high at 1.3651.
The pair currently trades last at 1.35917.
The previous day high was 1.3655 while the previous day low was 1.3601. The daily 38.2% Fib levels comes at 1.3622, expected to provide resistance. Similarly, the daily 61.8% fib level is at 1.3634, expected to provide resistance.
USD/CAD has shifted its auction below the round-level support of 1.3600 in the early European session. The Loonie asset has faced intensive selling pressure after a sharp decline in appeal for the US Dollar Index (DXY). The USD Index lost its appeal after US President Joe Biden comprised the scale of spending initiatives proposed for the budget for approving a raise in the United States borrowing cap limit to avoid default. US Treasury Secretary Janet Yellen already warned Congressional leaders that the Federal government could default by June 05 on obligated payments.
S&P500 futures have surrendered at least half of gains generated in early Asia after US President Joe Biden announced that an agreed deal on the US debt-ceiling is going to Congress. Investors have trimmed their positions in US equities as the US markets will remain closed on Monday on account of Memorial Day.
The US Dollar Index (DXY) has refreshed its day’s low at 104.11 after retreating from 104.20. The USD Index is struggling to firm its feet despite chances of further policy-tightening by the Federal Reserve (Fed). The street is anticipating more interest rate hikes from the Federal Reserve after a rebound in consumption expenditure by US households.
Vigorous negotiations among White House officials and House of Representatives Kevin McCarthy-led team concluded in early Asia after US President Joe Biden agreed to downsize the scale of spending initiatives proposed for the budget for raising the US debt-ceiling limit. The $31.4 trillion US borrowing limit has received approval for two years and fears of a default situation for the United States economy have faded. The White House agreed to cut spending for the budget but remained stubborn for neither cutting on health coverage nor increasing poverty.
Investors should note that an increase in the US debt-ceiling would attract credit rating agencies, which would downgrade the long-term credibility of the US economy. This may have a significant impact on the US Dollar Index (DXY) and US equities.
The expectations for a pause in the policy-tightening spell by the Federal Reserve (Fed) were extremely solid last week after Federal Reserve chair Jerome Powell announced that more rate hikes are less appropriate as tight credit conditions by US regional banks are weighing significant pressure on inflation.
Firms are struggling to fetch credit for augmenting working capital requirements, which has forced them to rely on less production capacity. However, the recent US Personal Consumption Expenditure (PCE) Price Index (April) showed that households’ spending is resilient despite the higher cost of living. The monthly headline and core PCE Price Index accelerated by 0.4%, higher than anticipated by market participants. Also, US Durable Goods Orders data expanded by 1.1% while the street was anticipating a contraction by 1.0%. Fresh incoming data is advocating for more interest rate hikes by the Federal Reserve.
A power-pack action is anticipated from the Canadian Dollar, this week, amid the release of the Gross Domestic Product (GDP) data, which will release on Wednesday. As per the preliminary report, monthly GDP (March) is seen contracting by 0.1% vs. an expansion of 0.1% recorded in February. Q1 and annualized GDP are seen significantly expanding by 0.4% and 2.1% respectively vs. a stagnant performance.
Resilience in the Canadian economy could force Bank of Canada (BoC) Governor Tiff Macklem to start hiking interest rates again. Investors should be aware that the Bank of Canada is keeping its interest rates steady from March considering that the current monetary policy is restrictive enough to tame stubborn inflation.
USD/CAD showed a stellar upside action after a breakout of the Symmetrical Triangle formed on a four-hour scale. The US Dollar bulls got strength after climbing above the downward-sloping trendline plotted from March 10 high at 1.3862. After an upside move, the Loonie asset has dropped after facing barricades around the horizontal resistance placed from April 26 high at 1.3651.
The asset has shown a mean-reversion move to near the 20-period Exponential Moving Average (EMA) at 1.3594.
A range shift move by the Relative Strength Index (RSI) (14) into the 40.00-60.00 territory from the bullish zone of 40.00-60.00 indicates a loss in the upside momentum.
Technical Levels: Supports and Resistances
USDCAD currently trading at 1.3597 at the time of writing. Pair opened at 1.3617 and is trading with a change of -0.15 % .
| Overview | Overview.1 | |
|---|---|---|
| 0 | Today last price | 1.3597 |
| 1 | Today Daily Change | -0.0020 |
| 2 | Today Daily Change % | -0.1500 |
| 3 | Today daily open | 1.3617 |
The pair remains strongly bullish on the daily timeframe. It trades above its 20 SMA @ 1.3507, 50 SMA 1.3525, 100 SMA @ 1.3511 and 200 SMA @ 1.3493.
| Trends | Trends.1 | |
|---|---|---|
| 0 | Daily SMA20 | 1.3507 |
| 1 | Daily SMA50 | 1.3525 |
| 2 | Daily SMA100 | 1.3511 |
| 3 | Daily SMA200 | 1.3493 |
The previous day high was 1.3655 while the previous day low was 1.3601. The daily 38.2% Fib levels comes at 1.3622, expected to provide resistance. Similarly, the daily 61.8% fib level is at 1.3634, expected to provide resistance.
Note the levels of interest below:
- Pivot support is noted at 1.3594, 1.357, 1.354
- Pivot resistance is noted at 1.3648, 1.3678, 1.3702
| Levels | Levels.1 |
|---|---|
| Previous Daily High | 1.3655 |
| Previous Daily Low | 1.3601 |
| Previous Weekly High | 1.3655 |
| Previous Weekly Low | 1.3485 |
| Previous Monthly High | 1.3668 |
| Previous Monthly Low | 1.3301 |
| Daily Fibonacci 38.2% | 1.3622 |
| Daily Fibonacci 61.8% | 1.3634 |
| Daily Pivot Point S1 | 1.3594 |
| Daily Pivot Point S2 | 1.3570 |
| Daily Pivot Point S3 | 1.3540 |
| Daily Pivot Point R1 | 1.3648 |
| Daily Pivot Point R2 | 1.3678 |
| Daily Pivot Point R3 | 1.3702 |
[/s2If]
Nehcap Expert Advisor
The NEHCAP MT4 EA is high quality professional trading system geared to generate returns without using GRID or martingales. Each trade has strict risk per trade parameter. The pairs under management include EURUSD, GBPUSD, AUDCAD, AUDNZD,GBPAUD, EURAUD, EURCAD, CHFJPY and many more.
The system is trading live: LIVE ACCOUNT TRACKING
You can run it free. Apply for a free trial and track our account. Buy the system or use profit share mechanism to generate returns on your MT4.
Join Our Telegram Group


