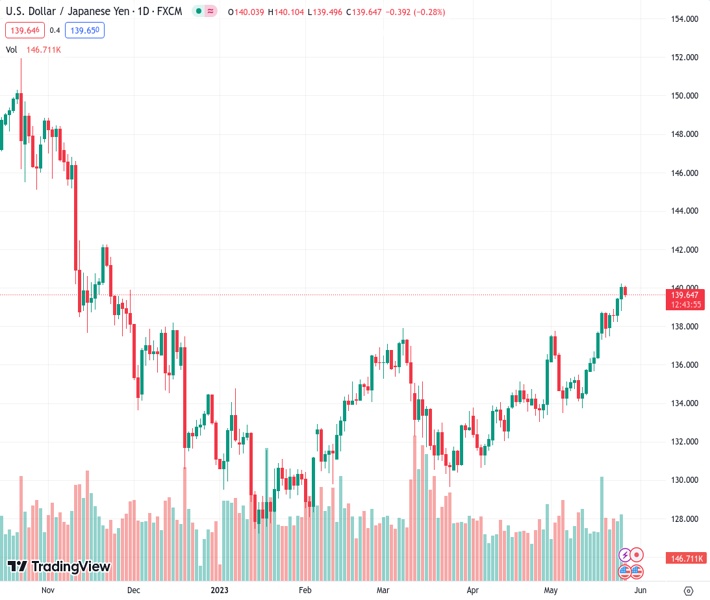
#USDJPY @ 139.623 retreats from the YTD peak amid a modest USD pullback from over a two-month high. (Pivot Orderbook analysis)
…
This is a premium post.
[s2If !current_user_can(access_s2member_level4)]Please register for FREE REGISTER to read full post below containing analysis. In case of any error or you think you are not able to read the full post below, please email us at support#nehcap.com [lwa][/s2If] [s2If current_user_can(access_s2member_level1)]
- USD/JPY retreats from the YTD peak amid a modest USD pullback from over a two-month high.
- A softer risk tone benefits the safe-haven JPY and further contributes to the intraday downfall.
- The Fed-BoJ policy divergence should help limit losses ahead of the US Core PCE Price Index.
The pair currently trades last at 139.623.
The previous day high was 140.23 while the previous day low was 138.82. The daily 38.2% Fib levels comes at 139.69, expected to provide resistance. Similarly, the daily 61.8% fib level is at 139.36, expected to provide support.
The USD/JPY pair comes under some selling pressure on the last day of the week and extends its steady intraday slide through the first half of the European session. Spot prices drop to mid-139.00s in the last hour, reversing the previous day’s positive move to the highest level since November 2022.
The US Dollar (USD) pulls back from over a two-month high touched on Thursday and turns out to be a key factor dragging the USD/JPY pair lower. The Japanese Yen (JPY), on the other hand, attracts some heaven flows amid growing worries of a global economic slowdown and US debt ceiling woes. This further contributes to the offered tone surrounding the major, though any meaningful corrective decline still seems elusive.
A more dovish stance adopted by the Bank of Japan (BoJ), along with the softer domestic data, could act as a headwind for the JPY and lend some support to the USD/JPY pair. In fact, BoJ Governor Kazuo Ueda had reiterated recently that the central bank will continue easing with yield curve control. Furthermore, the Tokyo CPI released this Friday showed that inflation in Japan’s capital city eased more than expected in May.
The Federal Reserve (Fed), on the other hand, is expected to keep interest rates higher for longer to combat stick inflation. In fact, the markets have started pricing in the possibility of another 25 bps lift-off at the June FOMC policy meeting and the bets were lifted by the recent comments by a slew of Fed officials. Adding to this, Thursday’s upbeat US macro data could allow the US central bank to stick to its hawkish stance.
This has been pushing the US Treasury bond yields higher recently, widening the US-Japan rate differential and supporting prospects for the emergence of some dip-buying around the USD/JPY pair. The USD bulls, however, seem reluctant to place aggressive bets and await the release of the Core PCE Price Index – the Fed’s preferred inflation gauge – later during the early North American session for a fresh impetus.
Technical Levels: Supports and Resistances
USDJPY currently trading at 139.53 at the time of writing. Pair opened at 140.07 and is trading with a change of -0.39 % .
| Overview | Overview.1 | |
|---|---|---|
| 0 | Today last price | 139.53 |
| 1 | Today Daily Change | -0.54 |
| 2 | Today Daily Change % | -0.39 |
| 3 | Today daily open | 140.07 |
The pair remains strongly bullish on the daily timeframe. It trades above its 20 SMA @ 136.62, 50 SMA 134.31, 100 SMA @ 133.43 and 200 SMA @ 137.21.
| Trends | Trends.1 | |
|---|---|---|
| 0 | Daily SMA20 | 136.62 |
| 1 | Daily SMA50 | 134.31 |
| 2 | Daily SMA100 | 133.43 |
| 3 | Daily SMA200 | 137.21 |
The previous day high was 140.23 while the previous day low was 138.82. The daily 38.2% Fib levels comes at 139.69, expected to provide resistance. Similarly, the daily 61.8% fib level is at 139.36, expected to provide support.
Note the levels of interest below:
- Pivot support is noted at 139.18, 138.3, 137.77
- Pivot resistance is noted at 140.59, 141.12, 142.0
| Levels | Levels.1 |
|---|---|
| Previous Daily High | 140.23 |
| Previous Daily Low | 138.82 |
| Previous Weekly High | 138.75 |
| Previous Weekly Low | 135.65 |
| Previous Monthly High | 136.56 |
| Previous Monthly Low | 130.63 |
| Daily Fibonacci 38.2% | 139.69 |
| Daily Fibonacci 61.8% | 139.36 |
| Daily Pivot Point S1 | 139.18 |
| Daily Pivot Point S2 | 138.30 |
| Daily Pivot Point S3 | 137.77 |
| Daily Pivot Point R1 | 140.59 |
| Daily Pivot Point R2 | 141.12 |
| Daily Pivot Point R3 | 142.00 |
[/s2If]
Nehcap Expert Advisor
The NEHCAP MT4 EA is high quality professional trading system geared to generate returns without using GRID or martingales. Each trade has strict risk per trade parameter. The pairs under management include EURUSD, GBPUSD, AUDCAD, AUDNZD,GBPAUD, EURAUD, EURCAD, CHFJPY and many more.
The system is trading live: LIVE ACCOUNT TRACKING
You can run it free. Apply for a free trial and track our account. Buy the system or use profit share mechanism to generate returns on your MT4.
Join Our Telegram Group
")


