#XAGUSD @ 23.050 Silver price has fit above $23.00 amid a sheer decline in the USD Index. (Pivot Orderbook analysis)
…
This is a premium post.
[s2If !current_user_can(access_s2member_level4)]Please register for FREE REGISTER to read full post below containing analysis. In case of any error or you think you are not able to read the full post below, please email us at support#nehcap.com [lwa][/s2If] [s2If current_user_can(access_s2member_level1)]
- Silver price has fit above $23.00 amid a sheer decline in the USD Index.
- White House officials and Speaker McCarthy-led team are vigorously involved in negotiations for raising the US debt-ceiling.
- Silver price has shown a decent recovery and has climbed back above the 50% Fibo retracement at $23.00.
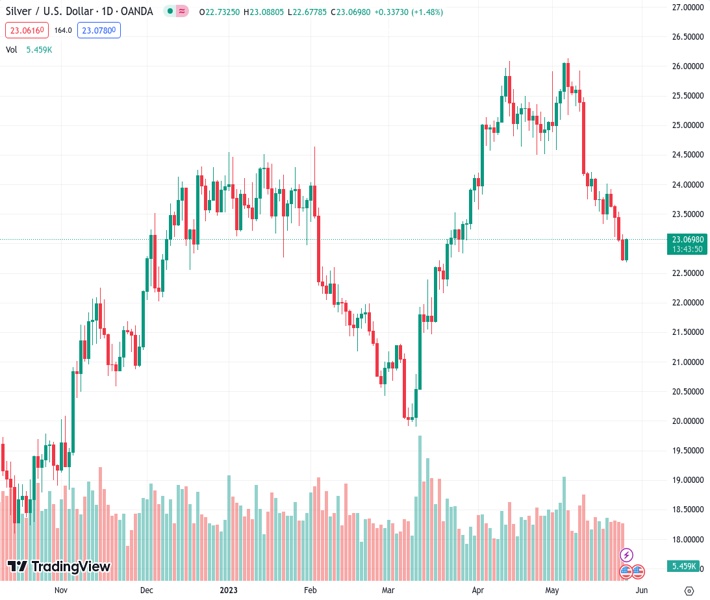
The pair currently trades last at 23.050.
The previous day high was 23.15 while the previous day low was 22.7. The daily 38.2% Fib levels comes at 22.87, expected to provide support. Similarly, the daily 61.8% fib level is at 22.98, expected to provide support.
Silver price (XAG/USD) has shifted comfortably above the critical resistance of $23.00 in the early European session. The white metal is extending its upside as the US Dollar Index (DXY) is looking vulnerable above 104.00.
The USD Index has sensed selling pressure as investors are expecting that the White House and Republican leaders will reach a bipartisan, which would support the United States Treasury in avoiding a default. White House officials and House of Representatives Kevin McCarthy-led team are vigorously involved in negotiations. The deviation in proposed budget spending by the White House to Republican leaders has narrowed to $70 billion from the original proposal of $1 trillion.
Meanwhile, signs of a pause in the policy-tightening spell by the Federal Reserve (Fed) are also fueling strength into the Silver price.
Silver price has shown a decent recovery and has climbed back above the 50% Fibonacci retracement (plotted March 08 low at $19.92 to April 14 high at $26.08) at $23.00 on a four-hour scale. The white metal has to pass through plenty of filters for a bullish reversal. The asset is still auctioning in a Falling Channel chart pattern.
The declining 20-period Exponential Moving Average (EMA) at $23.15 is acting as a barricade for the Silver price bulls.
The Relative Strength Index (RSI) (14) is making efforts for shifting into the 40.00-60.00 range.
A confident break above May 25 high at $23.14 will send the major toward May 18 low at $23.48 followed by May 19 high at 24.00.
On the flip side, a downside move below May 26 low at $22.68 will strengthen the US Dollar bulls and will drag the asset toward 61.8% Fibo retracement at $22.28 and the major support at $22.00.
Technical Levels: Supports and Resistances
XAGUSD currently trading at 23.08 at the time of writing. Pair opened at 22.74 and is trading with a change of 1.5 % .
| Overview | Overview.1 | |
|---|---|---|
| 0 | Today last price | 23.08 |
| 1 | Today Daily Change | 0.34 |
| 2 | Today Daily Change % | 1.50 |
| 3 | Today daily open | 22.74 |
The pair is trading below its 20 Daily moving average @ 24.47, below its 50 Daily moving average @ 24.34 , below its 100 Daily moving average @ 23.36 and above its 200 Daily moving average @ 22.0
| Trends | Trends.1 | |
|---|---|---|
| 0 | Daily SMA20 | 24.47 |
| 1 | Daily SMA50 | 24.34 |
| 2 | Daily SMA100 | 23.36 |
| 3 | Daily SMA200 | 22.00 |
The previous day high was 23.15 while the previous day low was 22.7. The daily 38.2% Fib levels comes at 22.87, expected to provide support. Similarly, the daily 61.8% fib level is at 22.98, expected to provide support.
Note the levels of interest below:
- Pivot support is noted at 22.58, 22.42, 22.13
- Pivot resistance is noted at 23.03, 23.32, 23.48
| Levels | Levels.1 |
|---|---|
| Previous Daily High | 23.15 |
| Previous Daily Low | 22.70 |
| Previous Weekly High | 24.21 |
| Previous Weekly Low | 23.33 |
| Previous Monthly High | 26.09 |
| Previous Monthly Low | 23.57 |
| Daily Fibonacci 38.2% | 22.87 |
| Daily Fibonacci 61.8% | 22.98 |
| Daily Pivot Point S1 | 22.58 |
| Daily Pivot Point S2 | 22.42 |
| Daily Pivot Point S3 | 22.13 |
| Daily Pivot Point R1 | 23.03 |
| Daily Pivot Point R2 | 23.32 |
| Daily Pivot Point R3 | 23.48 |
[/s2If]
Nehcap Expert Advisor
The NEHCAP MT4 EA is high quality professional trading system geared to generate returns without using GRID or martingales. Each trade has strict risk per trade parameter. The pairs under management include EURUSD, GBPUSD, AUDCAD, AUDNZD,GBPAUD, EURAUD, EURCAD, CHFJPY and many more.
The system is trading live: LIVE ACCOUNT TRACKING
You can run it free. Apply for a free trial and track our account. Buy the system or use profit share mechanism to generate returns on your MT4.
Join Our Telegram Group
")


