#AUDUSD @ 0.65075 The takes a hit, trading at around 0.6505, as US debt ceiling discussions fail to conclude and tech stocks gain momentum due to rising interest in AI. (Pivot Orderbook analysis)
…
This is a premium post.
[s2If !current_user_can(access_s2member_level4)]Please register for FREE REGISTER to read full post below containing analysis. In case of any error or you think you are not able to read the full post below, please email us at support#nehcap.com [lwa][/s2If] [s2If current_user_can(access_s2member_level1)]
- The AUD/USD takes a hit, trading at around 0.6505, as US debt ceiling discussions fail to conclude and tech stocks gain momentum due to rising interest in AI.
- The US economy demonstrates resilience with robust Retail Sales, Industrial Production, and a firm labor market, countering rising Initial Jobless Claims.
- Debt ceiling deadlock stirs fears over US AAA rating; Yellen warns of potential cash crunch by June.
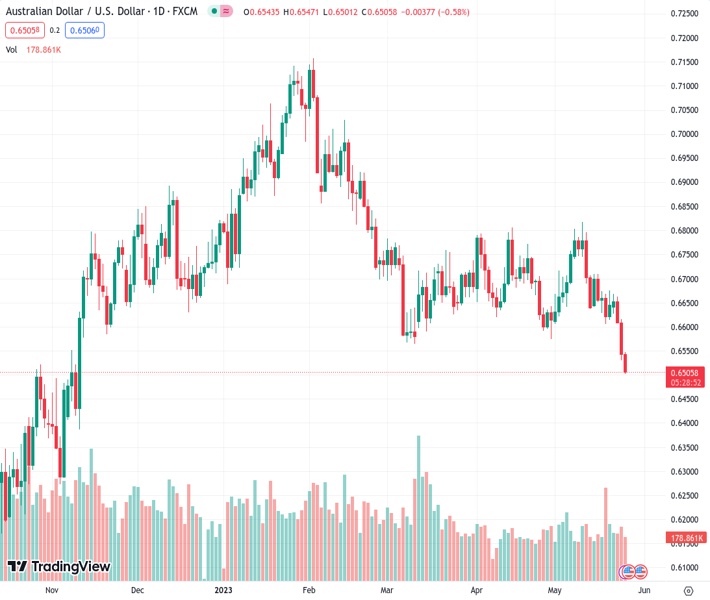
The pair currently trades last at 0.65075.
The previous day high was 0.6615 while the previous day low was 0.653. The daily 38.2% Fib levels comes at 0.6562, expected to provide resistance. Similarly, the daily 61.8% fib level is at 0.6583, expected to provide resistance.
AUD/USD tanks as Thursday’s North American session begins, amidst mixed market sentiment, with US debt ceiling discussions being the center stage, while the AI frenzy has taken tech stocks higher. In the meantime, the United States (US) economy is proving resilient amidst the recent data released. At the time of writing, the AUD/USD is trading at around 0.6511 after hitting a six-month low of 0.6503.
US economic data showed that Initial Jobless Claims for the week ending on May 20 rose by 229K below estimates of 245K, according to data from the US Department of Labor. The US economy has gained momentum as Retail Sales, Industrial Production, business activity, and a “tight” labor market underpinned the US Dollar (USD). In a separate report, the US Bureau of Labor Statistics (BLS) showed that the second estimate of Gross Domestic Product (GDP) for Q1 was revised from 1.1% to 1.3%.
In the meantime, the US Dollar Index, which measures the buck’s performance against a basket of six currencies, rises for four consecutive trading days, up 0.21%, at 104.103. It should be said that a double-bottom chart pattern looms, and with an upside break above 105.883, that will validate the pattern.
Must read: US Dollar Index: Reclaims 200-day EMA, surpasses 2017 yearly high, as bulls stepped in eyeing 104.000
US debt ceiling talks hit an impasse as the White House (WH) and the US Congress, led by US House Speaker Kevin McCarthy, failed to seal an agreement that could lift the US ceiling so that the country can pay its obligations, which, according to US Treasury Secretary Janet Yellen, saying the US would run out of cash by June 1. Some consequences of the political drama in Washington triggered a reaction by Fitch Rating, warning that the US AAA rating is under threat.
The AUD/USD continues to be pressured amidst the lack of a catalyst on the Australian front. The Reserve Bank of Australia’s (RBA) minutes showed the central bank’s beliefs that higher rates, inflation, and income tax would contribute to a slowdown in consumer spending.
Additionally, China’s economy losing momentum would likely keep the AUD/USD tilted to the downside. According to Bloomberg, “Recent data suggest gross domestic product growth this year will be closer to the government’s target of about 5%, contrary to expectations of a large overshoot formed earlier in the year.”
From a daily chart perspective, the AUD/USD is neutral to downward biased, with a clear path of challenging the November 10 daily low of 0.6386, but firstly, the AUD/USD pair must fall below crucial support levels. The first one would be 0.6500. A decisive break will expose the 0.6400 figure before testing the abovementioned area at the 0.6200 handle. Otherwise, if AUD/USD stays above 0.6500, the 0.6600 psychological figure is up for grabs.
Technical Levels: Supports and Resistances
AUDUSD currently trading at 0.651 at the time of writing. Pair opened at 0.6544 and is trading with a change of -0.52 % .
| Overview | Overview.1 | |
|---|---|---|
| 0 | Today last price | 0.6510 |
| 1 | Today Daily Change | -0.0034 |
| 2 | Today Daily Change % | -0.5200 |
| 3 | Today daily open | 0.6544 |
The pair remains strongly bearish on the daily time frame. It trades below the 20 SMA @ 0.6671, 50 SMA 0.6684, 100 SMA @ 0.678 and 200 SMA @ 0.6708.
| Trends | Trends.1 | |
|---|---|---|
| 0 | Daily SMA20 | 0.6671 |
| 1 | Daily SMA50 | 0.6684 |
| 2 | Daily SMA100 | 0.6780 |
| 3 | Daily SMA200 | 0.6708 |
The previous day high was 0.6615 while the previous day low was 0.653. The daily 38.2% Fib levels comes at 0.6562, expected to provide resistance. Similarly, the daily 61.8% fib level is at 0.6583, expected to provide resistance.
Note the levels of interest below:
- Pivot support is noted at 0.6511, 0.6477, 0.6425
- Pivot resistance is noted at 0.6596, 0.6649, 0.6682
| Levels | Levels.1 |
|---|---|
| Previous Daily High | 0.6615 |
| Previous Daily Low | 0.6530 |
| Previous Weekly High | 0.6710 |
| Previous Weekly Low | 0.6605 |
| Previous Monthly High | 0.6806 |
| Previous Monthly Low | 0.6574 |
| Daily Fibonacci 38.2% | 0.6562 |
| Daily Fibonacci 61.8% | 0.6583 |
| Daily Pivot Point S1 | 0.6511 |
| Daily Pivot Point S2 | 0.6477 |
| Daily Pivot Point S3 | 0.6425 |
| Daily Pivot Point R1 | 0.6596 |
| Daily Pivot Point R2 | 0.6649 |
| Daily Pivot Point R3 | 0.6682 |
[/s2If]
Nehcap Expert Advisor
The NEHCAP MT4 EA is high quality professional trading system geared to generate returns without using GRID or martingales. Each trade has strict risk per trade parameter. The pairs under management include EURUSD, GBPUSD, AUDCAD, AUDNZD,GBPAUD, EURAUD, EURCAD, CHFJPY and many more.
The system is trading live: LIVE ACCOUNT TRACKING
You can run it free. Apply for a free trial and track our account. Buy the system or use profit share mechanism to generate returns on your MT4.
Join Our Telegram Group
")


