#XAUUSD @ 1,957.82 Gold Price Forecast: tests lower range limit around mid-1,900s on rising US debt uncertainties, @nehcap view: Further downside expected (Pivot Orderbook analysis)
…
This is a premium post.
[s2If !current_user_can(access_s2member_level4)]Please register for FREE REGISTER to read full post below containing analysis. In case of any error or you think you are not able to read the full post below, please email us at support#nehcap.com [lwa][/s2If] [s2If current_user_can(access_s2member_level1)]
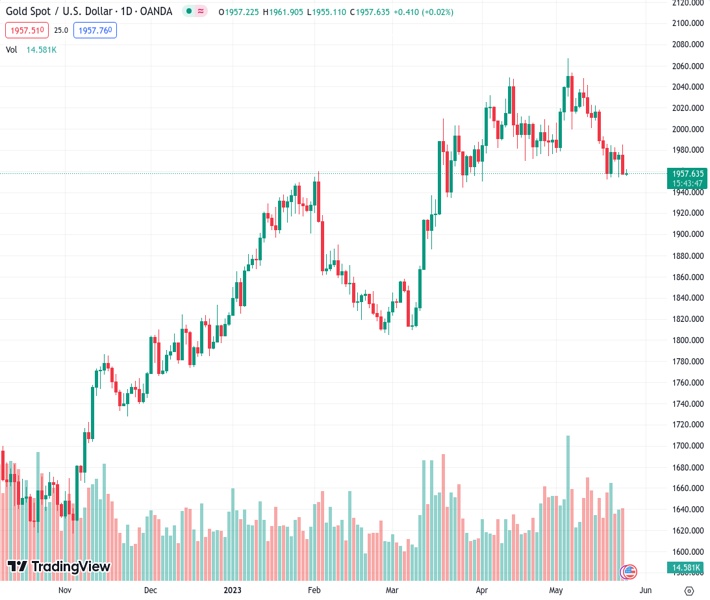
The pair currently trades last at 1957.82.
The previous day high was 1985.3 while the previous day low was 1956.79. The daily 38.2% Fib levels comes at 1967.68, expected to provide resistance. Similarly, the daily 61.8% fib level is at 1974.41, expected to provide resistance.
Gold Price (XAU/USD) struggles for clear directions as bulls and bears jostle around a short-term key support line nearing $1,955 heading into Thursday’s European session. In doing so, the yellow metal portrays the market’s indecision amid mixed signals surrounding the US debt limit extension talks and the US Federal Reserve (Fed). Also likely to prod the XAU/USD traders is the cautious mood ahead of a slew of mid-tier data from the US.
The US policymakers’ inability to deliver a debt ceiling extension deal and the looming long weekend for the House Representatives amplifies the US default fears even if the negotiators see progress in the latest rounds of talks. With this, global rating agencies like Fitch and Moody’s turned cautious about the US credit rating status while the US Treasury Department accepted their fears.
Elsewhere, the Minutes of the latest Federal Open Market Committee (FOMC) Meeting suggested that the policymakers are divided about the latest 0.25% rate hike from the US central bank. The same doubts the market’s bets on another such move in June. Even so, Atlanta Fed President Raphael Bostic said, “‘We’re right at the beginning of the hard part’ of taming inflation.” On the same line, Federal Reserve Governor Christopher Waller mentioned that he doesn’t support stopping rate hikes unless getting clear evidence that inflation is moving down toward the 2% objective.
On the other hand, the market’s expectations of more easing from China, amid record-high interbank Repo turnover, contrasts with the geopolitical fears to challenge the Gold price moves.
While portraying the mood, the S&P500 Futures snap a two-day downtrend by bouncing off a two-week low to 4,138 by the press time, up 0.39% intraday at the latest. On the other hand, the US 10-year and two-year Treasury bond yields remain firmer at the highest levels since mid-March, close to 3.75% and 4.40% as we write.
Moving on, the US weekly Jobless Claims, the Chicago Fed National Activity Index and Pending Home Sales will decorate the calendar but the debt ceiling talks will be crucial to watch for clear directions.
Gold price prods a one-week-old ascending support line surrounding $1,955 while staying within a short-term trading range established since May 16, currently between $1,985 and $1,951.
That said, the impending bull cross on the MACD and the below 50 conditions of the RSI (14) line defends the XAU/USD buyers.
However, a fortnight-long falling trend line and the 200-Hour Moving Average (HMA), respectively near $1,977 and $1,981, can restrict immediate upside moves of the Gold price.
It’s worth noting that the late March swing low of around $1,934 and the $2,000 psychological magnet are extra filters for the Gold price.
Overall, Gold prices consolidate recent gains amid sluggish markets but bears remain hopeful.
Trend: Further downside expected
Technical Levels: Supports and Resistances
XAUUSD currently trading at 1957.94 at the time of writing. Pair opened at 1957.11 and is trading with a change of 0.04% % .
| Overview | Overview.1 | |
|---|---|---|
| 0 | Today last price | 1957.94 |
| 1 | Today Daily Change | 0.83 |
| 2 | Today Daily Change % | 0.04% |
| 3 | Today daily open | 1957.11 |
The pair is trading below its 20 Daily moving average @ 2001.08, below its 50 Daily moving average @ 1992.02 , above its 100 Daily moving average @ 1933.1 and above its 200 Daily moving average @ 1828.59
| Trends | Trends.1 | |
|---|---|---|
| 0 | Daily SMA20 | 2001.08 |
| 1 | Daily SMA50 | 1992.02 |
| 2 | Daily SMA100 | 1933.10 |
| 3 | Daily SMA200 | 1828.59 |
The previous day high was 1985.3 while the previous day low was 1956.79. The daily 38.2% Fib levels comes at 1967.68, expected to provide resistance. Similarly, the daily 61.8% fib level is at 1974.41, expected to provide resistance.
Note the levels of interest below:
- Pivot support is noted at 1947.5, 1937.89, 1918.99
- Pivot resistance is noted at 1976.01, 1994.91, 2004.52
| Levels | Levels.1 |
|---|---|
| Previous Daily High | 1985.30 |
| Previous Daily Low | 1956.79 |
| Previous Weekly High | 2022.18 |
| Previous Weekly Low | 1952.01 |
| Previous Monthly High | 2048.75 |
| Previous Monthly Low | 1949.83 |
| Daily Fibonacci 38.2% | 1967.68 |
| Daily Fibonacci 61.8% | 1974.41 |
| Daily Pivot Point S1 | 1947.50 |
| Daily Pivot Point S2 | 1937.89 |
| Daily Pivot Point S3 | 1918.99 |
| Daily Pivot Point R1 | 1976.01 |
| Daily Pivot Point R2 | 1994.91 |
| Daily Pivot Point R3 | 2004.52 |
[/s2If]
Nehcap Expert Advisor
The NEHCAP MT4 EA is high quality professional trading system geared to generate returns without using GRID or martingales. Each trade has strict risk per trade parameter. The pairs under management include EURUSD, GBPUSD, AUDCAD, AUDNZD,GBPAUD, EURAUD, EURCAD, CHFJPY and many more.
The system is trading live: LIVE ACCOUNT TRACKING
You can run it free. Apply for a free trial and track our account. Buy the system or use profit share mechanism to generate returns on your MT4.
Join Our Telegram Group
")


