#USDZAR @ 19.3046 Price News: South African Rand drops to 19.30 ahead of SARB Interest Rate Decision (Pivot Orderbook analysis)
…
This is a premium post.
[s2If !current_user_can(access_s2member_level4)]Please register for FREE REGISTER to read full post below containing analysis. In case of any error or you think you are not able to read the full post below, please email us at support#nehcap.com [lwa][/s2If] [s2If current_user_can(access_s2member_level1)]
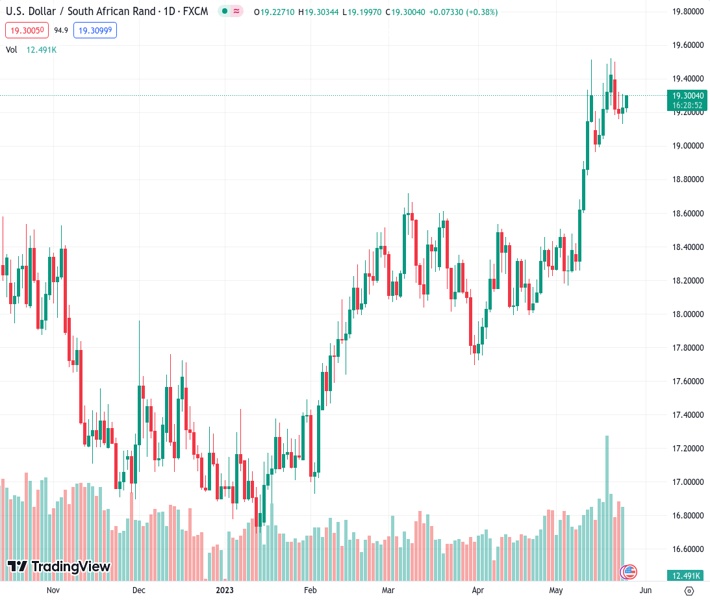
The pair currently trades last at 19.3046.
The previous day high was 19.3112 while the previous day low was 19.1355. The daily 38.2% Fib levels comes at 19.2441, expected to provide support. Similarly, the daily 61.8% fib level is at 19.2026, expected to provide support.
USD/ZAR renews its intraday high near 19.30 as it rises for the second consecutive day amid broad US Dollar strength on early Thursday. In doing so, the South African Rand (ZAR) pair prepares for today’s South African Reserve Bank (SARB) Interest Rate Announcements amid recent easy prints of the inflation at home.
On Wednesday, South Africa’s Consumer Price Index (CPI) for April eased to 6.8% YoY and 0.4% MoM versus 7.1% and 1.0% respective priors. The same challenges the SARB from being hawkish in today’s monetary policy announcements even if the South African central bank is all set for a 0.25% rate hike.
Even so, Goldman Sachs’ Andrew Matheny said, per Reuters, “The April CPI print was considerably more benign than in recent months. However, we think that the downside surprise is unlikely to have much bearing on the MPC decision tomorrow… given that, in our view, the SARB is mostly reacting to exchange rate weakness.”
On the other hand, the US Dollar Index (DXY) rises to a fresh high in seven weeks, to 104.05 by the press time, amid the US policymaker’s inability to deliver a debt ceiling extension deal and the looming long weekend for the House Representatives. With this, global rating agencies like Fitch and Moody’s turn cautious about the US credit rating status. Recently, the US Treasury Department accepted the rating agencies’ fears.
It should be noted that the Minutes of the latest Federal Open Market Committee (FOMC) Meeting suggested that the policymakers aren’t on the same table. Even so, Atlanta Fed President Raphael Bostic said, “‘We’re right at the beginning of the hard part’ of taming inflation.” On the same line, Federal Reserve Governor Christopher Waller mentioned that he doesn’t support stopping rate hikes unless getting clear evidence that inflation is moving down toward the 2% objective.
Amid these plays, the S&P500 Futures snap a two-day downtrend by bouncing off a two-week low to 4,138 by the press time, up 0.39% intraday at the latest. On the other hand, the US 10-year and two-year Treasury bond yields remain firmer at the highest levels since mid-March, close to 3.75% and 4.40% as we write.
Looking forward, the SARB Interest Rate Decision is the key for the USD/ZAR pair and can allow the buyers to challenge the all-time high marked the last week if offering a dovish hike. Following that, the US weekly Jobless Claims, the Chicago Fed National Activity Index and Pending Home Sales will decorate the calendar but the debt ceiling talks will be crucial to watch for clear directions.
A two-week-old ascending triangle formation restricts immediate USD/ZAR moves between 19.53 and 19.15.
Technical Levels: Supports and Resistances
USDZAR currently trading at 19.3042 at the time of writing. Pair opened at 19.2522 and is trading with a change of 0.27% % .
| Overview | Overview.1 | |
|---|---|---|
| 0 | Today last price | 19.3042 |
| 1 | Today Daily Change | 0.0520 |
| 2 | Today Daily Change % | 0.27% |
| 3 | Today daily open | 19.2522 |
The pair remains strongly bullish on the daily timeframe. It trades above its 20 SMA @ 18.8333, 50 SMA 18.4528, 100 SMA @ 18.076 and 200 SMA @ 17.7987.
| Trends | Trends.1 | |
|---|---|---|
| 0 | Daily SMA20 | 18.8333 |
| 1 | Daily SMA50 | 18.4528 |
| 2 | Daily SMA100 | 18.0760 |
| 3 | Daily SMA200 | 17.7987 |
The previous day high was 19.3112 while the previous day low was 19.1355. The daily 38.2% Fib levels comes at 19.2441, expected to provide support. Similarly, the daily 61.8% fib level is at 19.2026, expected to provide support.
Note the levels of interest below:
- Pivot support is noted at 19.1547, 19.0573, 18.9791
- Pivot resistance is noted at 19.3304, 19.4086, 19.506
| Levels | Levels.1 |
|---|---|
| Previous Daily High | 19.3112 |
| Previous Daily Low | 19.1355 |
| Previous Weekly High | 19.5250 |
| Previous Weekly Low | 18.9943 |
| Previous Monthly High | 18.5399 |
| Previous Monthly Low | 17.7526 |
| Daily Fibonacci 38.2% | 19.2441 |
| Daily Fibonacci 61.8% | 19.2026 |
| Daily Pivot Point S1 | 19.1547 |
| Daily Pivot Point S2 | 19.0573 |
| Daily Pivot Point S3 | 18.9791 |
| Daily Pivot Point R1 | 19.3304 |
| Daily Pivot Point R2 | 19.4086 |
| Daily Pivot Point R3 | 19.5060 |
[/s2If]
Nehcap Expert Advisor
The NEHCAP MT4 EA is high quality professional trading system geared to generate returns without using GRID or martingales. Each trade has strict risk per trade parameter. The pairs under management include EURUSD, GBPUSD, AUDCAD, AUDNZD,GBPAUD, EURAUD, EURCAD, CHFJPY and many more.
The system is trading live: LIVE ACCOUNT TRACKING
You can run it free. Apply for a free trial and track our account. Buy the system or use profit share mechanism to generate returns on your MT4.
Join Our Telegram Group
")


