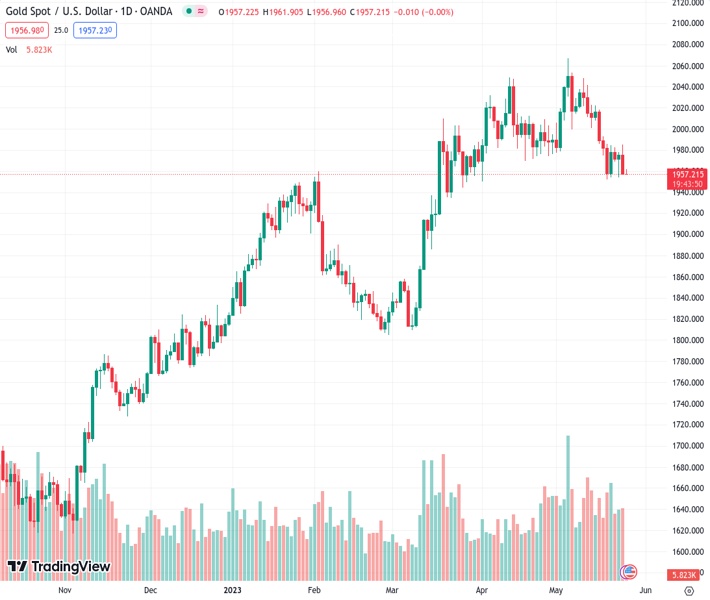
#XAUUSD @ 1,957.04 Gold price has shifted its auction below $1,960.00 amid sheer strength in the USD Index. (Pivot Orderbook analysis)
…
This is a premium post.
[s2If !current_user_can(access_s2member_level4)]Please register for FREE REGISTER to read full post below containing analysis. In case of any error or you think you are not able to read the full post below, please email us at support#nehcap.com [lwa][/s2If] [s2If current_user_can(access_s2member_level1)]
- Gold price has shifted its auction below $1,960.00 amid sheer strength in the USD Index.
- Fed policymakers believe that further rate hike in June is ‘less certain’ due to the banking fiasco.
- Gold price is forming an Inverted Flag pattern, which is a trend continuation pattern in which a long consolidation is followed by a breakdown.
The pair currently trades last at 1957.04.
The previous day high was 1985.3 while the previous day low was 1956.79. The daily 38.2% Fib levels comes at 1967.68, expected to provide resistance. Similarly, the daily 61.8% fib level is at 1974.41, expected to provide resistance.
Gold price (XAU/USD) has shifted its placement below $1,960.00 in the Asian session. The precious metal is looking to deliver more downside as the US Dollar Index (DXY) is looking to refresh its 10-week high to 104.00 ahead. The USD Index has shown immense strength as US debt-ceiling issues are not resolved despite long negotiations among the White House and Republican leaders.
S&P500 futures are holding significant gains in the Asian session. US equities have not carry-forwarded weak cues witnessed on Wednesday. The US Dollar Index (DXY) has refreshed its day’s high at 103.92 as uncertainty for US borrowing cap issues is escalating.
US House of Representatives Kevin McCarthy refused to support additional taxes for the Wealthy community and higher budget spending, which has delayed issues further, however, he remained confident that a bipartisan will be reached.
Gold price has failed to capitalize on dovish cues for interest rate guidance in the Federal Open Market Committee (FOMC) minutes. Federal Reserve (Fed) policymakers believe that further rate hike in June is ‘less certain’ due to a potential banking fiasco.
Later this week, US Durable Goods Orders data will be keenly watched. The economic data is seen contracting by 1.0% vs. an expansion of 3.2%.
Gold price is forming an Inverted Flag chart pattern on a four-hour scale, which is a trend continuation pattern in which a long consolidation is followed by a breakdown. The Gold price is hovering above the horizontal support plotted from April 03 low at $1,949.83.
The 20-period Exponential Moving Average (EMA) at $1,969.26 is barricading the Gold price from any rally.
Meanwhile, the Relative Strength Index (RSI) (14) has slipped below 40.00, which indicates that the downside momentum is warranted.
Technical Levels: Supports and Resistances
XAUUSD currently trading at 1959.47 at the time of writing. Pair opened at 1957.11 and is trading with a change of 0.12 % .
| Overview | Overview.1 | |
|---|---|---|
| 0 | Today last price | 1959.47 |
| 1 | Today Daily Change | 2.36 |
| 2 | Today Daily Change % | 0.12 |
| 3 | Today daily open | 1957.11 |
The pair is trading below its 20 Daily moving average @ 2001.08, below its 50 Daily moving average @ 1992.02 , above its 100 Daily moving average @ 1933.1 and above its 200 Daily moving average @ 1828.59
| Trends | Trends.1 | |
|---|---|---|
| 0 | Daily SMA20 | 2001.08 |
| 1 | Daily SMA50 | 1992.02 |
| 2 | Daily SMA100 | 1933.10 |
| 3 | Daily SMA200 | 1828.59 |
The previous day high was 1985.3 while the previous day low was 1956.79. The daily 38.2% Fib levels comes at 1967.68, expected to provide resistance. Similarly, the daily 61.8% fib level is at 1974.41, expected to provide resistance.
Note the levels of interest below:
- Pivot support is noted at 1947.5, 1937.89, 1918.99
- Pivot resistance is noted at 1976.01, 1994.91, 2004.52
| Levels | Levels.1 |
|---|---|
| Previous Daily High | 1985.30 |
| Previous Daily Low | 1956.79 |
| Previous Weekly High | 2022.18 |
| Previous Weekly Low | 1952.01 |
| Previous Monthly High | 2048.75 |
| Previous Monthly Low | 1949.83 |
| Daily Fibonacci 38.2% | 1967.68 |
| Daily Fibonacci 61.8% | 1974.41 |
| Daily Pivot Point S1 | 1947.50 |
| Daily Pivot Point S2 | 1937.89 |
| Daily Pivot Point S3 | 1918.99 |
| Daily Pivot Point R1 | 1976.01 |
| Daily Pivot Point R2 | 1994.91 |
| Daily Pivot Point R3 | 2004.52 |
[/s2If]
Nehcap Expert Advisor
The NEHCAP MT4 EA is high quality professional trading system geared to generate returns without using GRID or martingales. Each trade has strict risk per trade parameter. The pairs under management include EURUSD, GBPUSD, AUDCAD, AUDNZD,GBPAUD, EURAUD, EURCAD, CHFJPY and many more.
The system is trading live: LIVE ACCOUNT TRACKING
You can run it free. Apply for a free trial and track our account. Buy the system or use profit share mechanism to generate returns on your MT4.
Join Our Telegram Group


