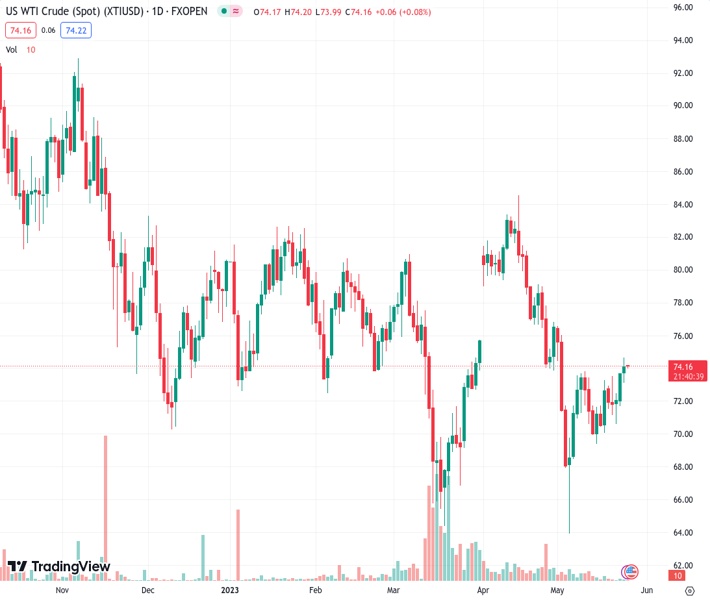
WTI grinds near three-week high above $74.00 amid surprise draw in Oil inventories, firmer US Dollar (Pivot Orderbook analysis)
…
This is a premium post.
[s2If !current_user_can(access_s2member_level4)]Please register for FREE REGISTER to read full post below containing analysis. In case of any error or you think you are not able to read the full post below, please email us at support#nehcap.com [lwa][/s2If] [s2If current_user_can(access_s2member_level1)]
The pair currently trades last at 74.1.
The previous day high was 73.77 while the previous day low was 71.7. The daily 38.2% Fib levels comes at 72.98, expected to provide support. Similarly, the daily 61.8% fib level is at 72.49, expected to provide support.
WTI crude oil stays defensive above $74.00 amid early hours of Thursday’s Asian session, after refreshing a three-week top the previous day. In doing so, the black gold justifies the mixed catalysts about the Oil inventories and the US Dollar.
The energy benchmark refreshed multi-day high after the Energy Information Institute (EIA) reported a massive draw in the weekly inventory levels. That said, the EIA Crude Oil Stocks Change came in at -12.456M versus 0.775M market forecasts and 5.04M previous readings.
Apart from the EIA inventories, warning from Saudi Arabia also fuel the WTI prices. That said, Saudi Arabia’s energy minister said short-sellers betting oil prices will fall should “watch out” for pain.
On the other hand, the US Dollar Index (DXY) rose for the third consecutive day to mark the highest levels since March 20, firmer around 103.90 by the press time.
While tracing the DXY catalysts, the market’s fears of the US default, as well as indecision about the Federal Reserve’s (Fed) next move, gain major attention.
That said, US House Speaker Kevin McCarthy said that they are sending their negotiators to the White House to try and finish up debt-limit talks. Alternatively, reports took rounds that the US House members will go back to their homes after Thursday, to cheer the long weekend, before resuming the debt ceiling negotiations, which in turn will escalate the fears of no deal before late May.
It should be noted that the Minutes of the latest Federal Open Market Committee (FOMC) Meeting suggested that the policymakers aren’t on the same table as some suggest it is appropriate to hike the rates while others advocate for a policy pivot.
Talking about the Fed commentary, Federal Reserve (Fed) Bank of Atlanta President Raphael Bostic said, “‘We’re right at the beginning of the hard part’ of taming inflation.” On the same line, Federal Reserve Governor Christopher Waller mentioned that he doesn’t support stopping rate hikes unless getting clear evidence that inflation is moving down towards 2% objective.
Amid these plays, S&P500 Futures print mild gains despite downbeat Wall Street performance whereas the yields remain sidelined after rising to the highest levels since mid-March the previous day.
Moving on, Oil traders should pay attention to risk catalysts for clear directions. Among them the US policymakers’ negotiations to avoid the expiry of the debt ceiling will gain major attention.
Although the Oil’s clear upside break of the mid-May peak of around $73.80 enables WTI bulls to keep the reins, the 50-DMA and 100-DMA, respectively near $74.55 and $76.10, can challenge the upside momentum.
Technical Levels: Supports and Resistances
XTIUSD currently trading at 74.1 at the time of writing. Pair opened at 73.75 and is trading with a change of 0.47 % .
| Overview | Overview.1 | |
|---|---|---|
| 0 | Today last price | 74.10 |
| 1 | Today Daily Change | 0.35 |
| 2 | Today Daily Change % | 0.47 |
| 3 | Today daily open | 73.75 |
The pair is trading above its 20 Daily moving average @ 72.28, below its 50 Daily moving average @ 74.39 , below its 100 Daily moving average @ 76.05 and below its 200 Daily moving average @ 79.85
| Trends | Trends.1 | |
|---|---|---|
| 0 | Daily SMA20 | 72.28 |
| 1 | Daily SMA50 | 74.39 |
| 2 | Daily SMA100 | 76.05 |
| 3 | Daily SMA200 | 79.85 |
The previous day high was 73.77 while the previous day low was 71.7. The daily 38.2% Fib levels comes at 72.98, expected to provide support. Similarly, the daily 61.8% fib level is at 72.49, expected to provide support.
Note the levels of interest below:
- Pivot support is noted at 72.38, 71.0, 70.3
- Pivot resistance is noted at 74.45, 75.15, 76.53
| Levels | Levels.1 |
|---|---|
| Previous Daily High | 73.77 |
| Previous Daily Low | 71.70 |
| Previous Weekly High | 73.55 |
| Previous Weekly Low | 69.39 |
| Previous Monthly High | 83.40 |
| Previous Monthly Low | 73.88 |
| Daily Fibonacci 38.2% | 72.98 |
| Daily Fibonacci 61.8% | 72.49 |
| Daily Pivot Point S1 | 72.38 |
| Daily Pivot Point S2 | 71.00 |
| Daily Pivot Point S3 | 70.30 |
| Daily Pivot Point R1 | 74.45 |
| Daily Pivot Point R2 | 75.15 |
| Daily Pivot Point R3 | 76.53 |
[/s2If]
Nehcap Expert Advisor
The NEHCAP MT4 EA is high quality professional trading system geared to generate returns without using GRID or martingales. Each trade has strict risk per trade parameter. The pairs under management include EURUSD, GBPUSD, AUDCAD, AUDNZD,GBPAUD, EURAUD, EURCAD, CHFJPY and many more.
The system is trading live: LIVE ACCOUNT TRACKING
You can run it free. Apply for a free trial and track our account. Buy the system or use profit share mechanism to generate returns on your MT4.
Join Our Telegram Group


