#XAUUSD @ 1,958.56 Gold Price Forecast: bears eye $1,925 as US Dollar, yields rise amid debt ceiling woes, @nehcap view: Further downside expected (Pivot Orderbook analysis)
…
This is a premium post.
[s2If !current_user_can(access_s2member_level4)]Please register for FREE REGISTER to read full post below containing analysis. In case of any error or you think you are not able to read the full post below, please email us at support#nehcap.com [lwa][/s2If] [s2If current_user_can(access_s2member_level1)]
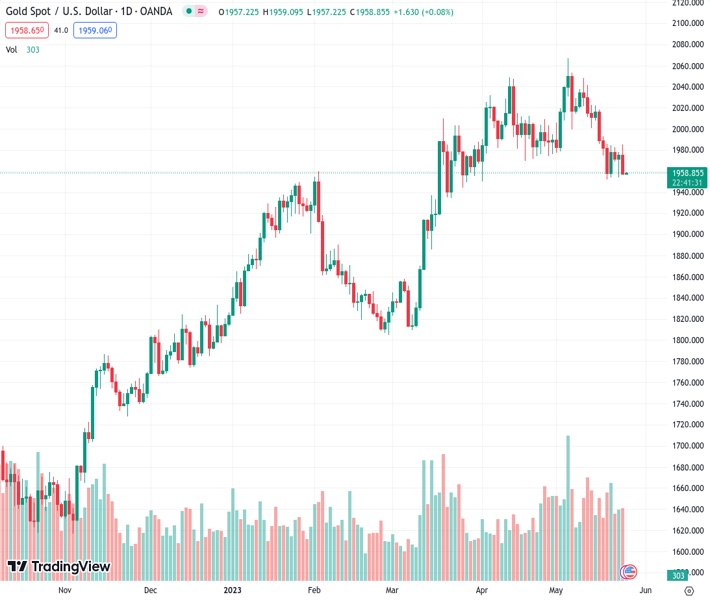
The pair currently trades last at 1958.56.
The previous day high was 1977.81 while the previous day low was 1954.28. The daily 38.2% Fib levels comes at 1968.82, expected to provide resistance. Similarly, the daily 61.8% fib level is at 1963.27, expected to provide resistance.
Gold Price (XAU/USD) remains pressured at weekly low, surrounding the key support juncture, as bears keep the reins around $1,957 during early Thursday in Asia. In doing so, the bright metal bears the burden of the firmer United States Treasury bond yields and the US Dollar amid market’s fears of the US default, as well as indecision about the Federal Reserve’s (Fed) next move.
Gold price holds onto its bearish trajectory and is likely to register the third consecutive weekly loss amid fears that the United States policymakers won’t be able to avoid the ‘catastrophic’ default. Adding strength to the XAU/USD’s downside is the indecision surrounding the Federal Reserve’s (Fed) next move.
On Wednesday, US House Speaker Kevin McCarthy said that they are sending their negotiators to the White House to try and finish up debt-limit talks. On the same line, US Treasury Secretary Janet Yellen said that that they will try to increase the level of precision on the date and noted that there will be some obligations that they will not be able to pay. Also reports took rounds that the US House members will go back to their homes after Thursday, to cheer the long weekend, before resuming the debt ceiling negotiations, which in turn will escalate the fears of no deal before late May.
On the other hand, Minutes of the latest Federal Open Market Committee (FOMC) Meeting suggested that the policymakers aren’t on the same table as some suggests its appropriate to hike the rates while the others advocate for a policy pivot. Recently, Federal Reserve (Fed) Bank of Atlanta President Raphael Bostic said, “’We’re right at the beginning of the hard part’ of taming inflation.”
Against this backdrop, the US Dollar Index (DXY) rose for the third consecutive day to mark the highest levels since March 20 while the benchmark US Treasury bond yields also rose to the mid-March highs. That said, Wall Street closed in the red and the same exerted downside pressure on the Gold price.
Moving on, the US weekly Jobless Claims, second reading of the Q1 GDP estimate, the Chicago Fed National Activity Index and Pending Home Sales are on the economic calendar to entertain the Gold traders. However, major attention will be given to the United States debt ceiling drama for clear directions.
Gold price extends pullback from a three-week-old descending resistance line as it prods the monthly low of around $1,952, quickly followed by January’s peak of around $1,950.
It’s worth noting that the XAU/USD’s sustained trading below the 50-DMA joins the bearish signals from the Moving Average Convergence and Divergence (MACD) indicator to keep the sellers hopeful. However, the below 50.0 levels of the Relative Strength Index (RSI) line, placed at 14, suggests limited downside room for the quote.
As a result, the odds of the Gold price rebound from the 100-DMA support of $1,933, in case the quote breaks the $1,950 support, are higher. If at all the XAU/USD breaks the 100-DMA support, an upward-sloping support line from early November, close to $1,924, will be the key to watch for clear directions.
On the contrary, a daily closing beyond the stated resistance line of near $1,968 needs validation from the 50-DMA resistance of $1,992, as well as the $2,000 round figure, to convince the Gold buyers.
Even so, April’s high of $2,048 and the $2,050 round figure may prod the XAU/USD upside before challenging the record top marked earlier in the month around $2,080.
Overall, the Gold price remains on the bear’s radar below the $2,000 mark but the downside room appears limited.
Trend: Further downside expected
Technical Levels: Supports and Resistances
XAUUSD currently trading at 1957.11 at the time of writing. Pair opened at 1975.21 and is trading with a change of -0.92 % .
| Overview | Overview.1 | |
|---|---|---|
| 0 | Today last price | 1957.11 |
| 1 | Today Daily Change | -18.10 |
| 2 | Today Daily Change % | -0.92 |
| 3 | Today daily open | 1975.21 |
The pair is trading below its 20 Daily moving average @ 2002.67, below its 50 Daily moving average @ 1990.96 , above its 100 Daily moving average @ 1931.91 and above its 200 Daily moving average @ 1827.68
| Trends | Trends.1 | |
|---|---|---|
| 0 | Daily SMA20 | 2002.67 |
| 1 | Daily SMA50 | 1990.96 |
| 2 | Daily SMA100 | 1931.91 |
| 3 | Daily SMA200 | 1827.68 |
The previous day high was 1977.81 while the previous day low was 1954.28. The daily 38.2% Fib levels comes at 1968.82, expected to provide resistance. Similarly, the daily 61.8% fib level is at 1963.27, expected to provide resistance.
Note the levels of interest below:
- Pivot support is noted at 1960.39, 1945.57, 1936.86
- Pivot resistance is noted at 1983.92, 1992.63, 2007.45
| Levels | Levels.1 |
|---|---|
| Previous Daily High | 1977.81 |
| Previous Daily Low | 1954.28 |
| Previous Weekly High | 2022.18 |
| Previous Weekly Low | 1952.01 |
| Previous Monthly High | 2048.75 |
| Previous Monthly Low | 1949.83 |
| Daily Fibonacci 38.2% | 1968.82 |
| Daily Fibonacci 61.8% | 1963.27 |
| Daily Pivot Point S1 | 1960.39 |
| Daily Pivot Point S2 | 1945.57 |
| Daily Pivot Point S3 | 1936.86 |
| Daily Pivot Point R1 | 1983.92 |
| Daily Pivot Point R2 | 1992.63 |
| Daily Pivot Point R3 | 2007.45 |
[/s2If]
Nehcap Expert Advisor
The NEHCAP MT4 EA is high quality professional trading system geared to generate returns without using GRID or martingales. Each trade has strict risk per trade parameter. The pairs under management include EURUSD, GBPUSD, AUDCAD, AUDNZD,GBPAUD, EURAUD, EURCAD, CHFJPY and many more.
The system is trading live: LIVE ACCOUNT TRACKING
You can run it free. Apply for a free trial and track our account. Buy the system or use profit share mechanism to generate returns on your MT4.
Join Our Telegram Group


