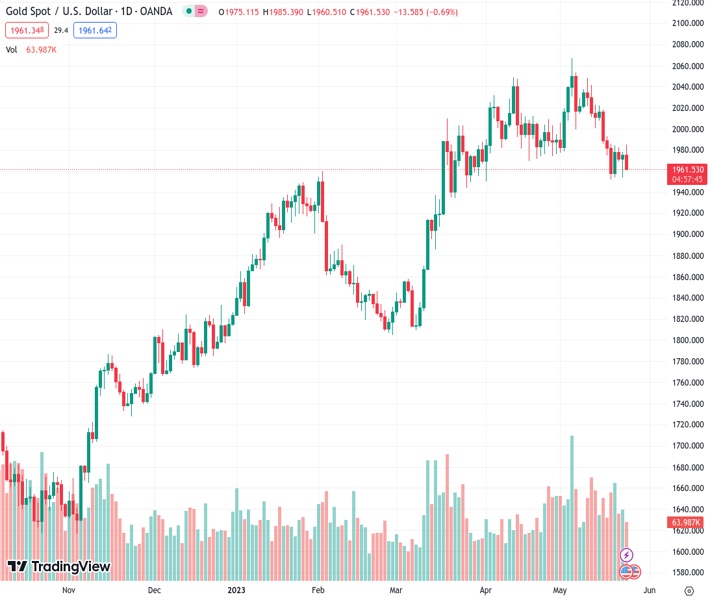
#XAUUSD @ 1,962.42 Gold price hits resistance at 50-day EMA of $1976.47, retraces as US Congress and the White House fail to progress on fiscal talks. (Pivot Orderbook analysis)
…
This is a premium post.
[s2If !current_user_can(access_s2member_level4)]Please register for FREE REGISTER to read full post below containing analysis. In case of any error or you think you are not able to read the full post below, please email us at support#nehcap.com [lwa][/s2If] [s2If current_user_can(access_s2member_level1)]
- Gold price hits resistance at 50-day EMA of $1976.47, retraces as US Congress and the White House fail to progress on fiscal talks.
- US Dollar Index (DXY) advances 0.25% amid the stalemate, rising above its 200-day EMA for the first time since March 15, 2023, as XAU/USD slips.
- Traders await the release of the US Federal Reserve Open Market Committee (FOMC) minutes after a dovish rate hike in May.
The pair currently trades last at 1962.42.
The previous day high was 1977.81 while the previous day low was 1954.28. The daily 38.2% Fib levels comes at 1968.82, expected to provide resistance. Similarly, the daily 61.8% fib level is at 1963.27, expected to provide resistance.
Gold price faces solid resistance at the 50-day Exponential Moving Average (EMA) at $1976.47, retraces some of its earlier gains after hitting a daily high of $1985.27. Talks between the US Congress and the White House (WH) failed to provide any relief; hence market participants are triggering toward safe-haven assets, not being Gold one of them. At the time of writing, XAU/USD is trading at $1969.20, down by 0.20%.
Wall Street continues to print losses as sentiment remains dented by the political uncertainty in the United States (US). Several reports on Tuesday updated that talks between President Biden and US House Speaker McCarthy did not make much progress. Divisions are seen in spending cuts proposed by the Republicans, while the White House is pushing for more taxes as part of the agreement.
Recently, US Treasury Secretary Janet Yellen said that “It is hard to be precise exactly which day we will run out of resources,” on Wednesday, as reported by Reuters. The former Fed Chair Yellen added that her office would try to increase the level of precision on the date the US Government will rule out of money.
Before Wall Street opened, XAU/USD rallied towards its daily high above $1985 just to see those gains evaporate as the greenback is staging a comeback, propelled by US bond yields. US real yields are climbing, standing at 1.449%, as shown by Treasury Inflation-Protected Securities (TIPS), while the 10-year benchmark note yields 3.709%, up one bps.
In the meantime, the US Dollar Index (DXY), a gauge of the buck’s value against a basket of its rivals, advance 0.25%, up at 103.776, above its 200-day Exponential Moving Average (EMA) for the first time since March 15, 2023.
XAU/USD traders will focus on the release of the US Federal Reserve Open Market Committee (FOMC) minutes at around 18:00 GMT, where the Federal Reserve (Fed) delivered a dovish rate hike of 25 basis points (bps) at its May 2-3 meeting. Traders would scrutinize the minutes, looking for clues about Fed Chair Jerome Powell and Co’s forward path.
XAU/USD is still neutral-biased, though a daily close below the 50-day Exponential Moving Average (EMA) can open the door for further weakness. However, sellers are still pending from breaking below the $1950 psychological level, tested three times in the last five trading days, with Gold sellers unable to drag prices toward the 100-day EMA at $1933.84. In that outcome, the next support would be the $1900 mark. Otherwise, Gold’s daily close above $1977 will keep buyers hopeful of a re-test of the $2000 figure.
Technical Levels: Supports and Resistances
XAUUSD currently trading at 1969.09 at the time of writing. Pair opened at 1975.21 and is trading with a change of -0.31 % .
| Overview | Overview.1 | |
|---|---|---|
| 0 | Today last price | 1969.09 |
| 1 | Today Daily Change | -6.12 |
| 2 | Today Daily Change % | -0.31 |
| 3 | Today daily open | 1975.21 |
The pair is trading below its 20 Daily moving average @ 2002.67, below its 50 Daily moving average @ 1990.96 , above its 100 Daily moving average @ 1931.91 and above its 200 Daily moving average @ 1827.68
| Trends | Trends.1 | |
|---|---|---|
| 0 | Daily SMA20 | 2002.67 |
| 1 | Daily SMA50 | 1990.96 |
| 2 | Daily SMA100 | 1931.91 |
| 3 | Daily SMA200 | 1827.68 |
The previous day high was 1977.81 while the previous day low was 1954.28. The daily 38.2% Fib levels comes at 1968.82, expected to provide resistance. Similarly, the daily 61.8% fib level is at 1963.27, expected to provide resistance.
Note the levels of interest below:
- Pivot support is noted at 1960.39, 1945.57, 1936.86
- Pivot resistance is noted at 1983.92, 1992.63, 2007.45
| Levels | Levels.1 |
|---|---|
| Previous Daily High | 1977.81 |
| Previous Daily Low | 1954.28 |
| Previous Weekly High | 2022.18 |
| Previous Weekly Low | 1952.01 |
| Previous Monthly High | 2048.75 |
| Previous Monthly Low | 1949.83 |
| Daily Fibonacci 38.2% | 1968.82 |
| Daily Fibonacci 61.8% | 1963.27 |
| Daily Pivot Point S1 | 1960.39 |
| Daily Pivot Point S2 | 1945.57 |
| Daily Pivot Point S3 | 1936.86 |
| Daily Pivot Point R1 | 1983.92 |
| Daily Pivot Point R2 | 1992.63 |
| Daily Pivot Point R3 | 2007.45 |
[/s2If]
Nehcap Expert Advisor
The NEHCAP MT4 EA is high quality professional trading system geared to generate returns without using GRID or martingales. Each trade has strict risk per trade parameter. The pairs under management include EURUSD, GBPUSD, AUDCAD, AUDNZD,GBPAUD, EURAUD, EURCAD, CHFJPY and many more.
The system is trading live: LIVE ACCOUNT TRACKING
You can run it free. Apply for a free trial and track our account. Buy the system or use profit share mechanism to generate returns on your MT4.
Join Our Telegram Group


